Will the coming weeks run warmer or cooler, wetter or drier than normal? These are chances, not day-by-day forecasts. A colored area means one side is more likely there. White means no lean either way ("equal chances").
6 to 10 days
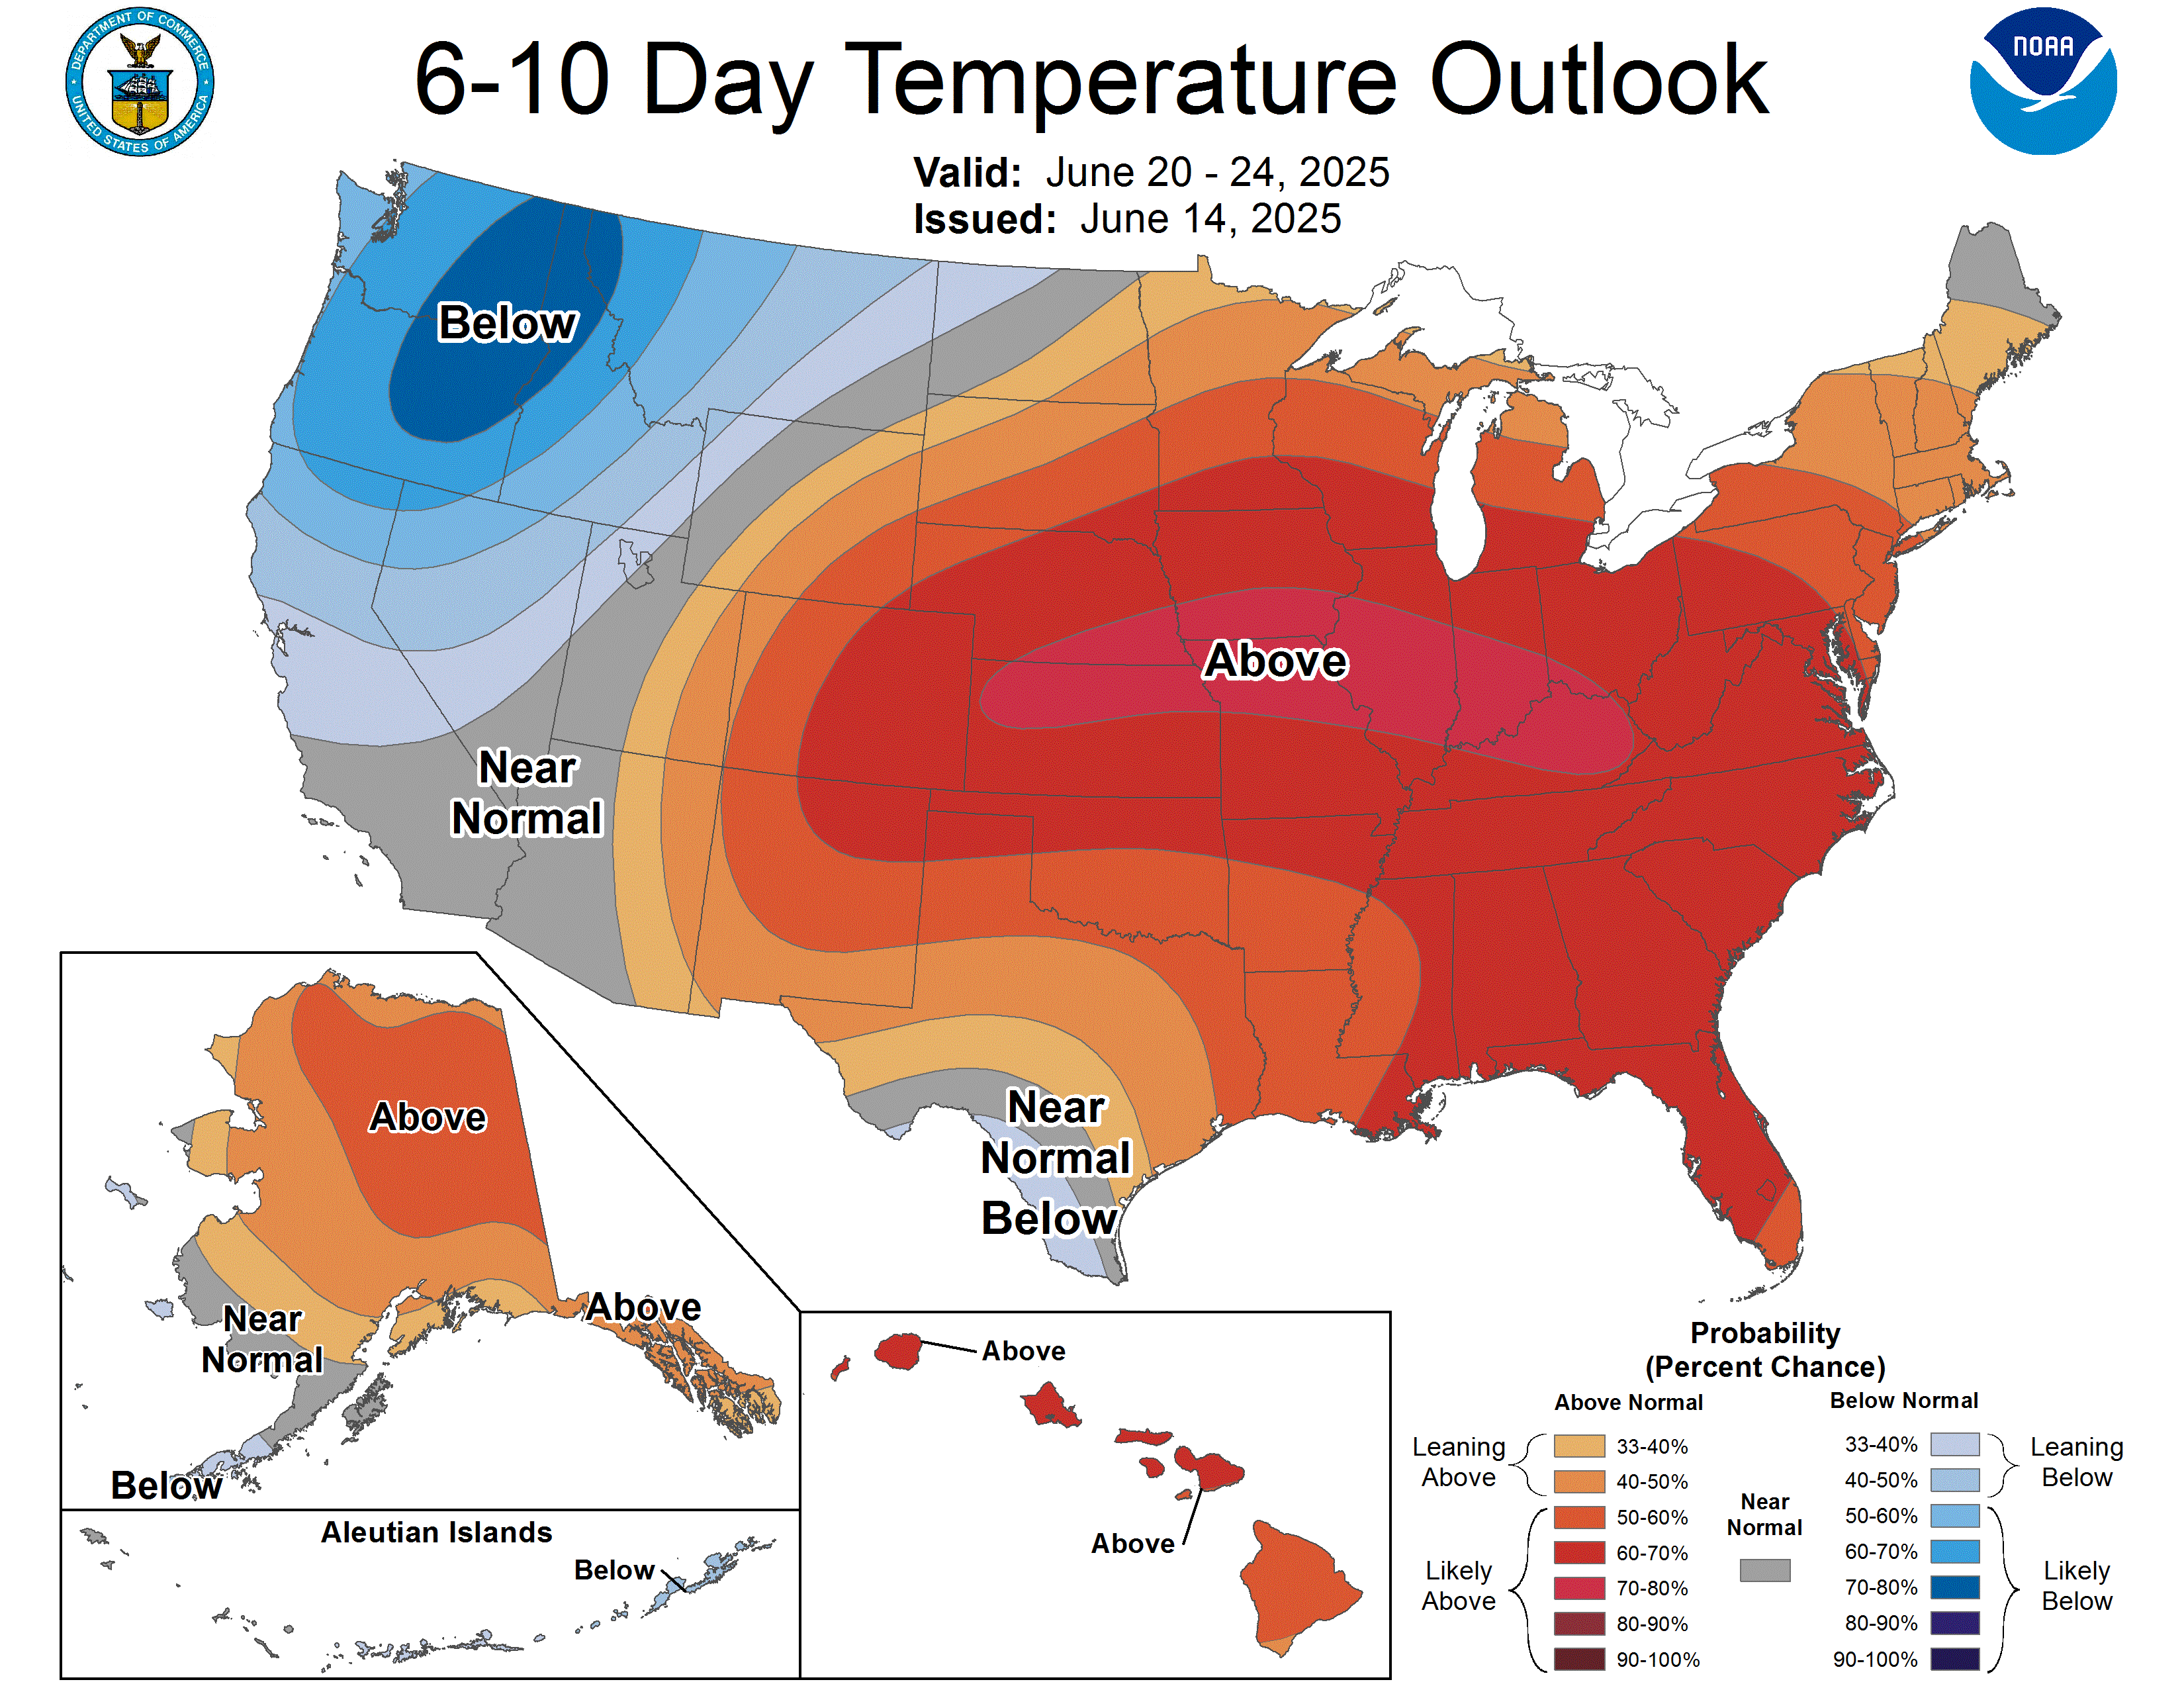
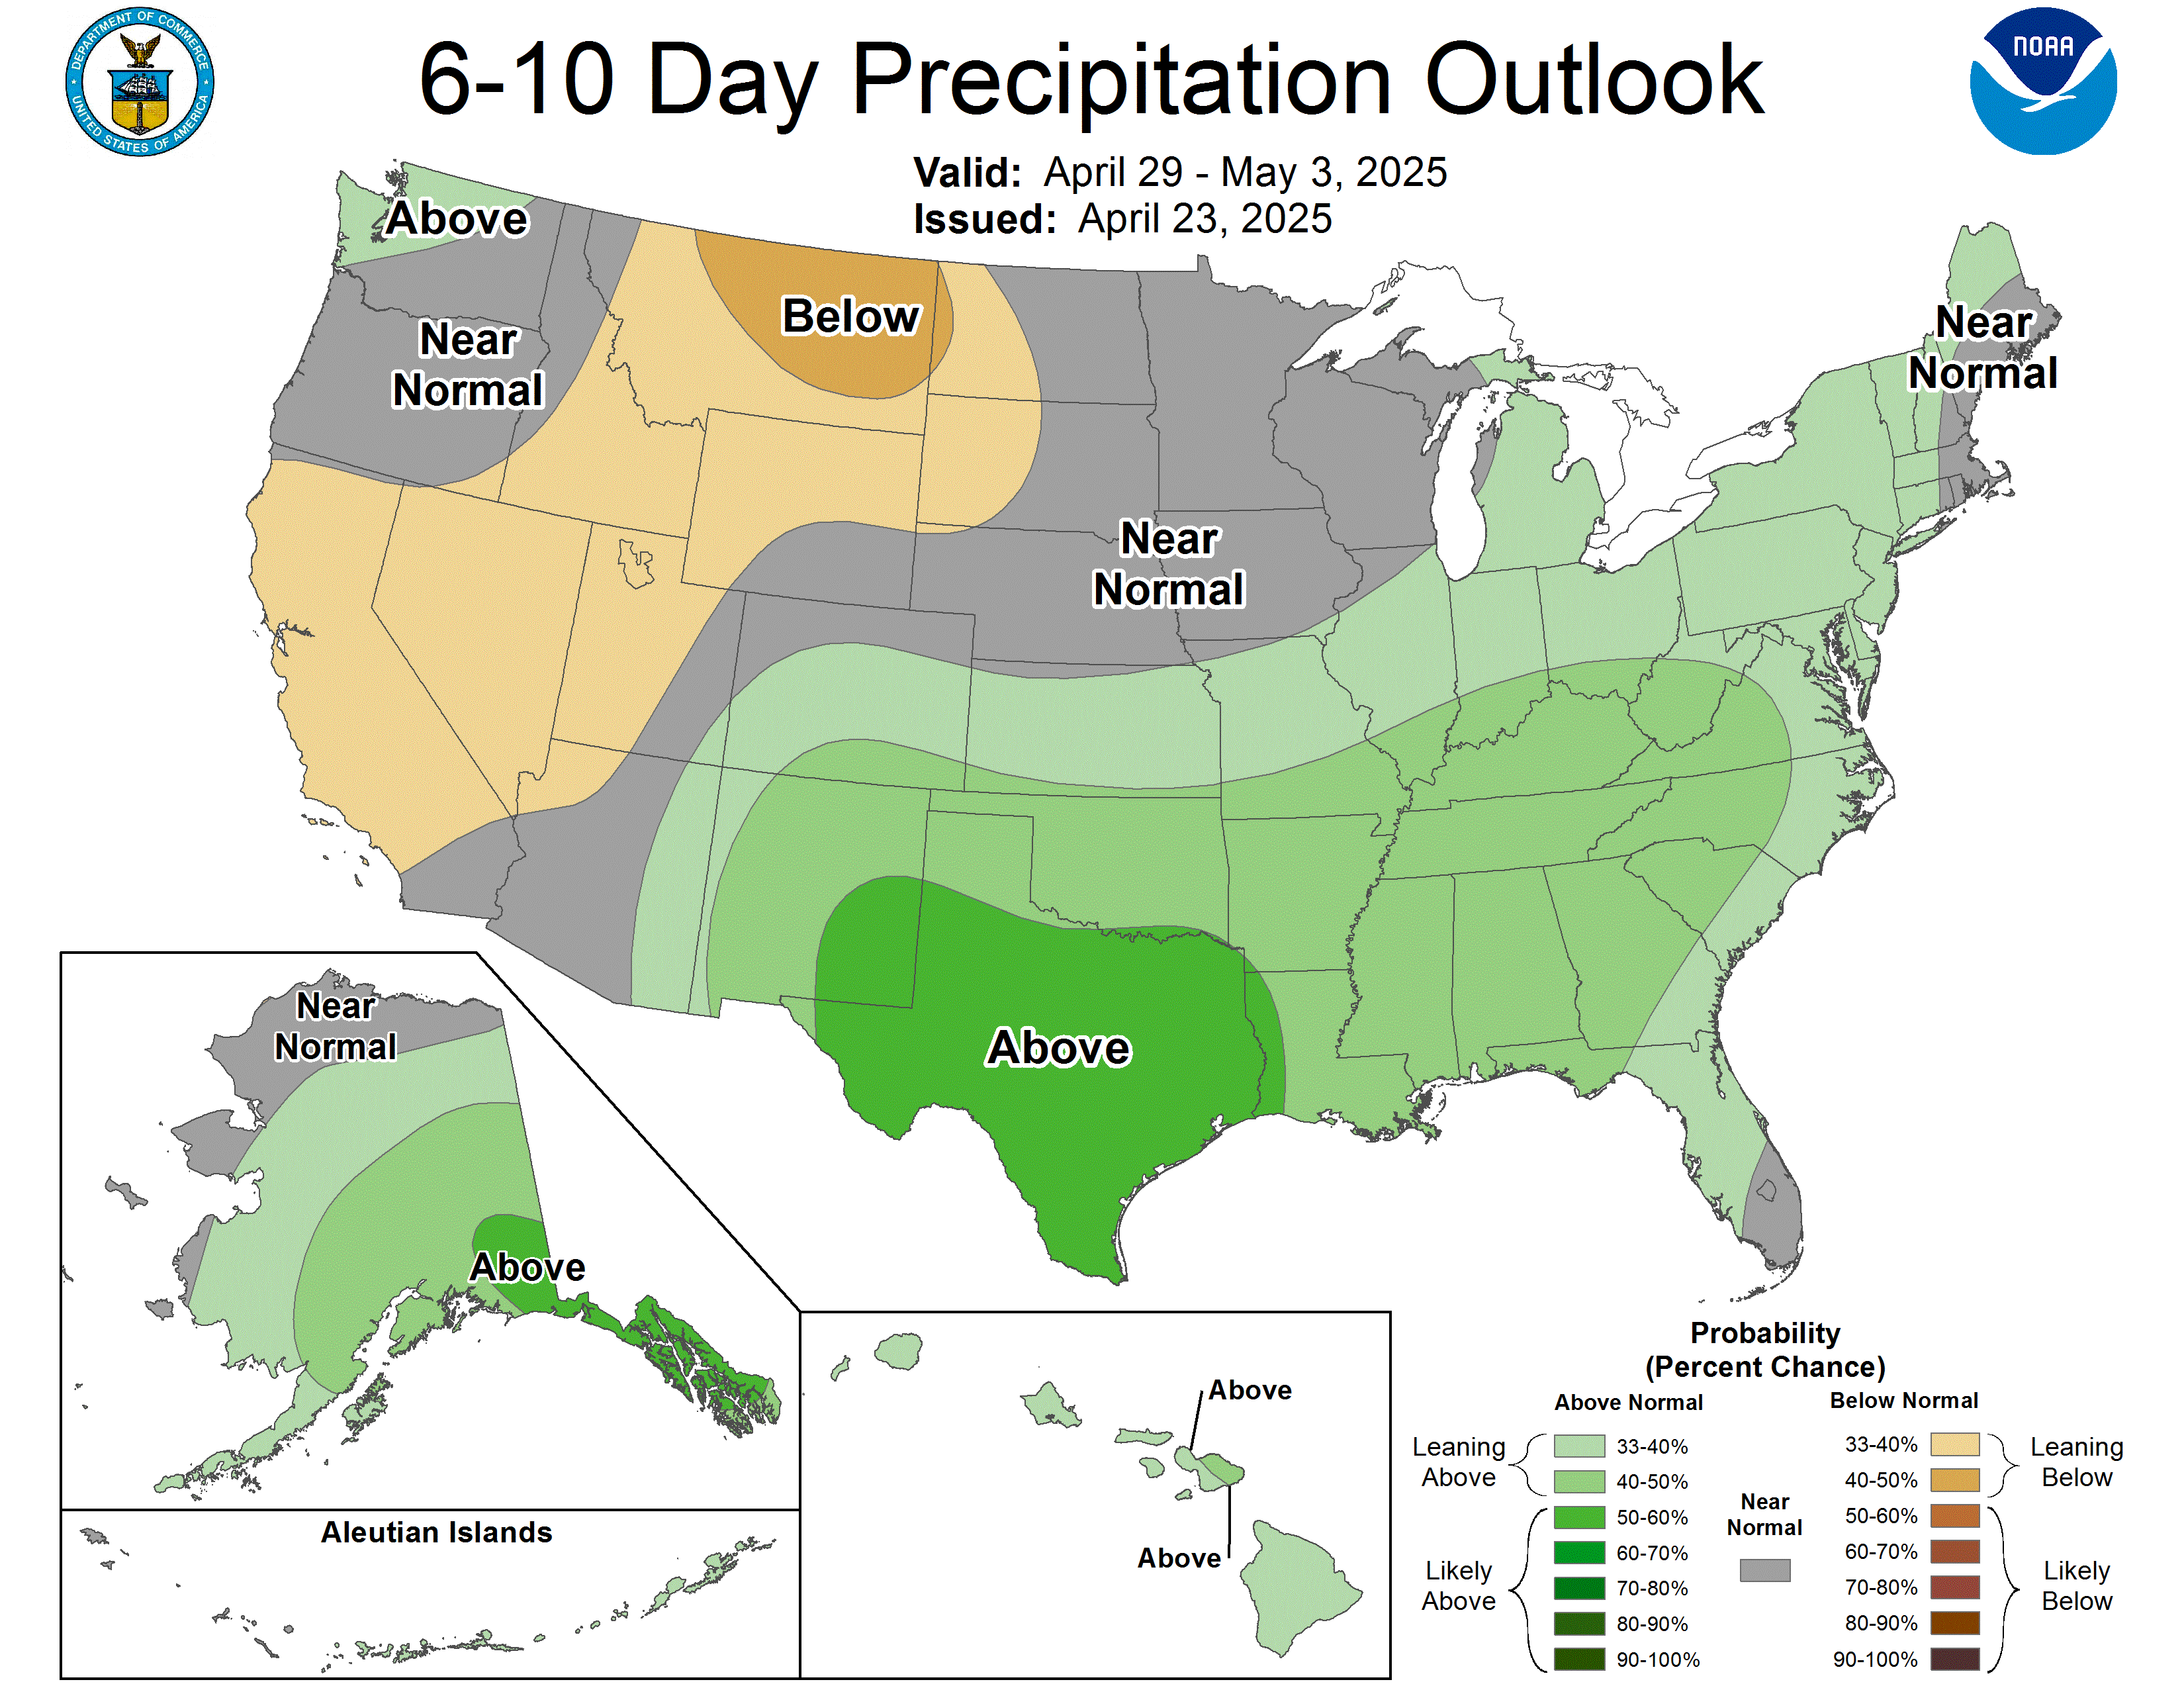
Updated every afternoon. CPC's page and forecaster discussion
8 to 14 days
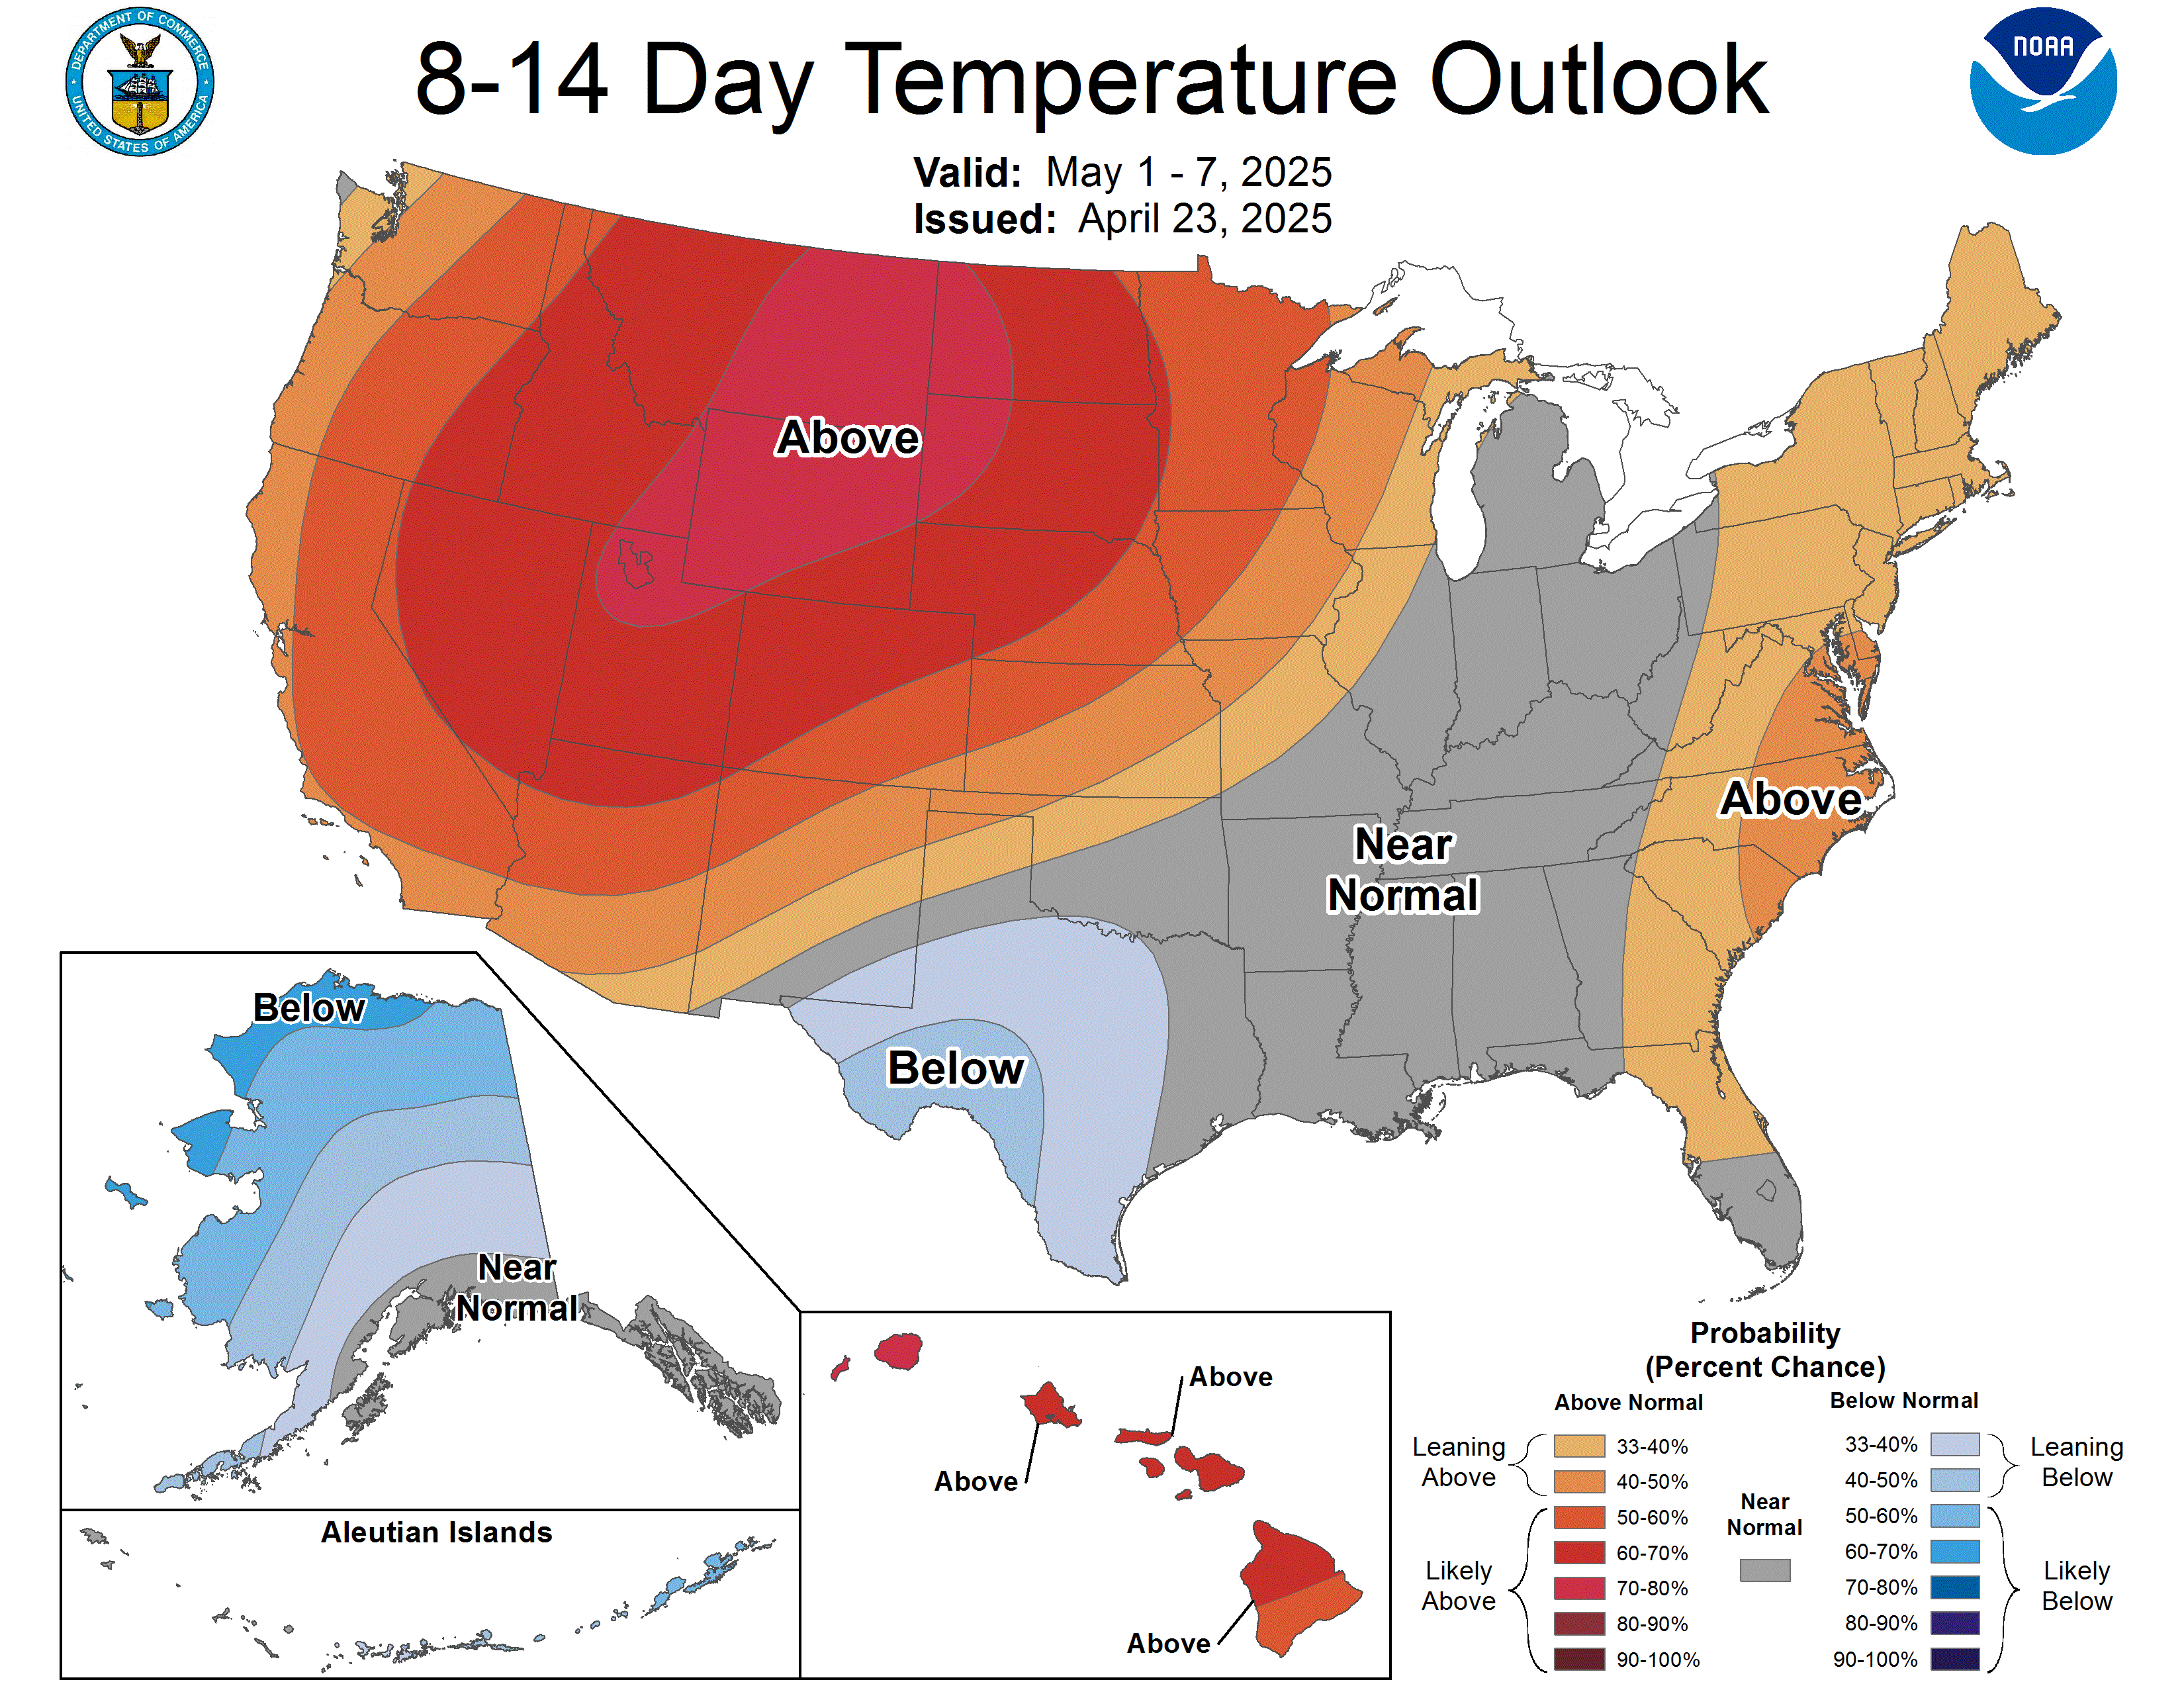
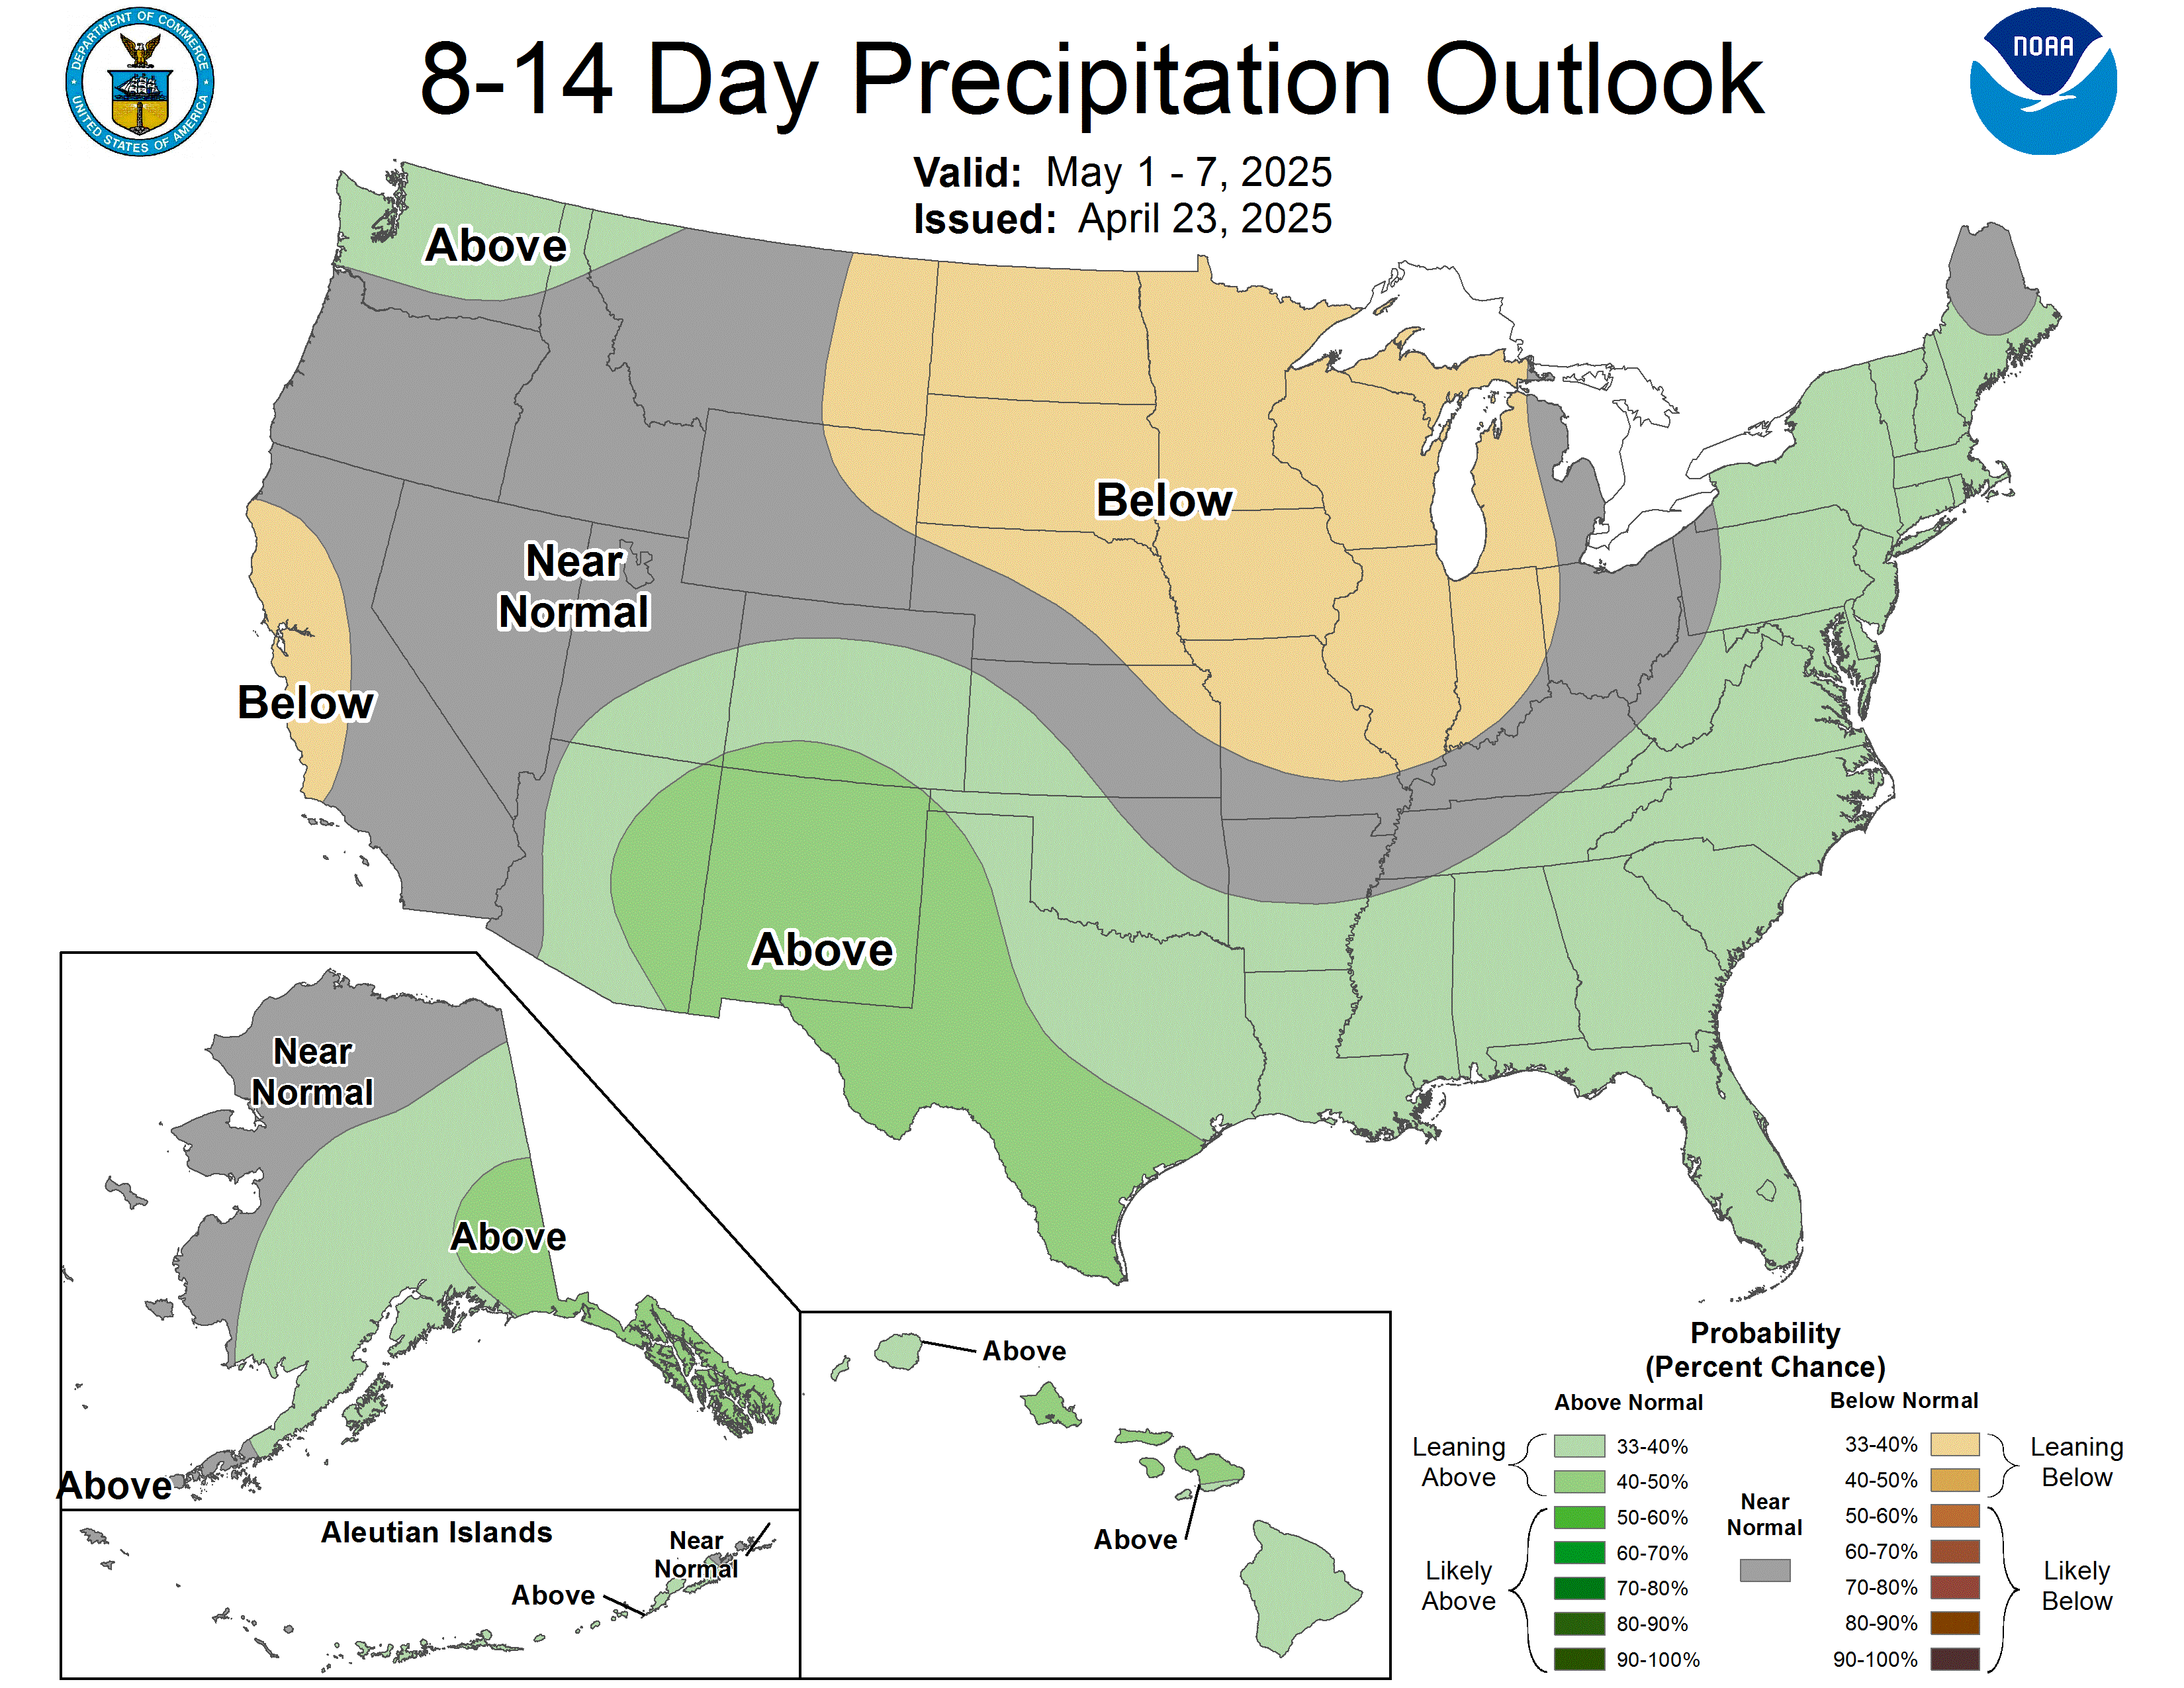
Updated every afternoon. CPC's page and forecaster discussion
Weeks 3 and 4
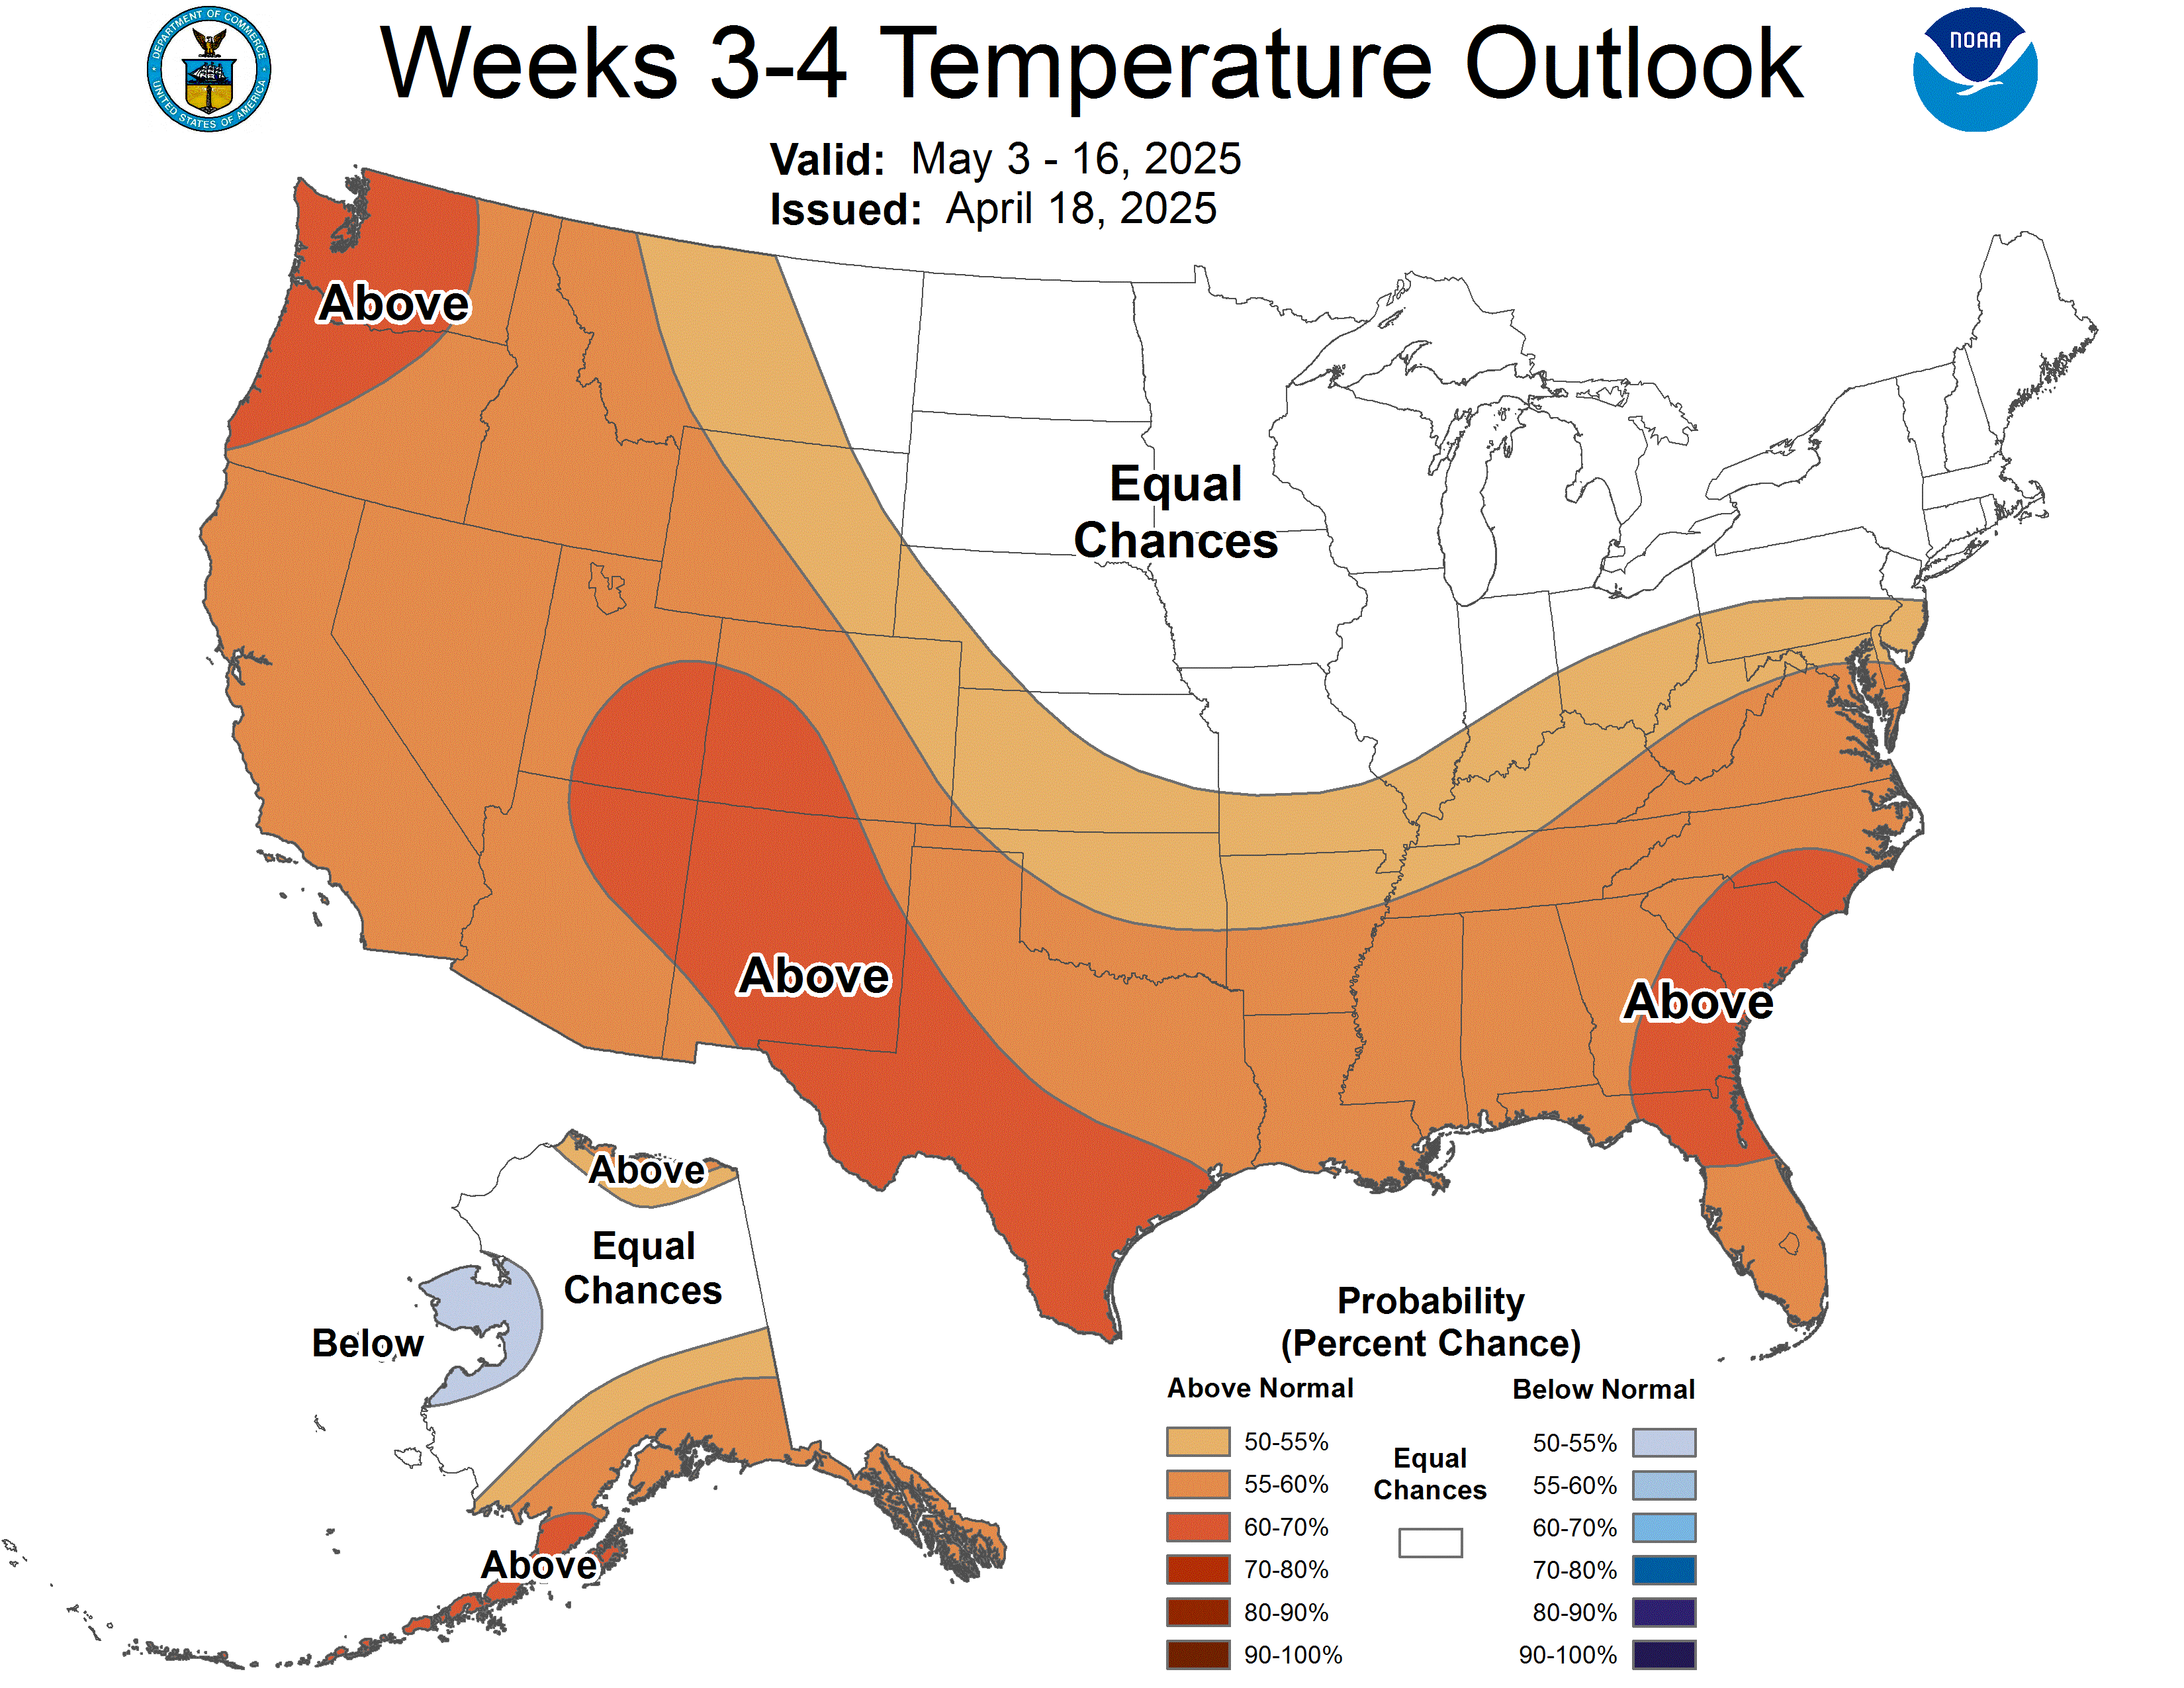
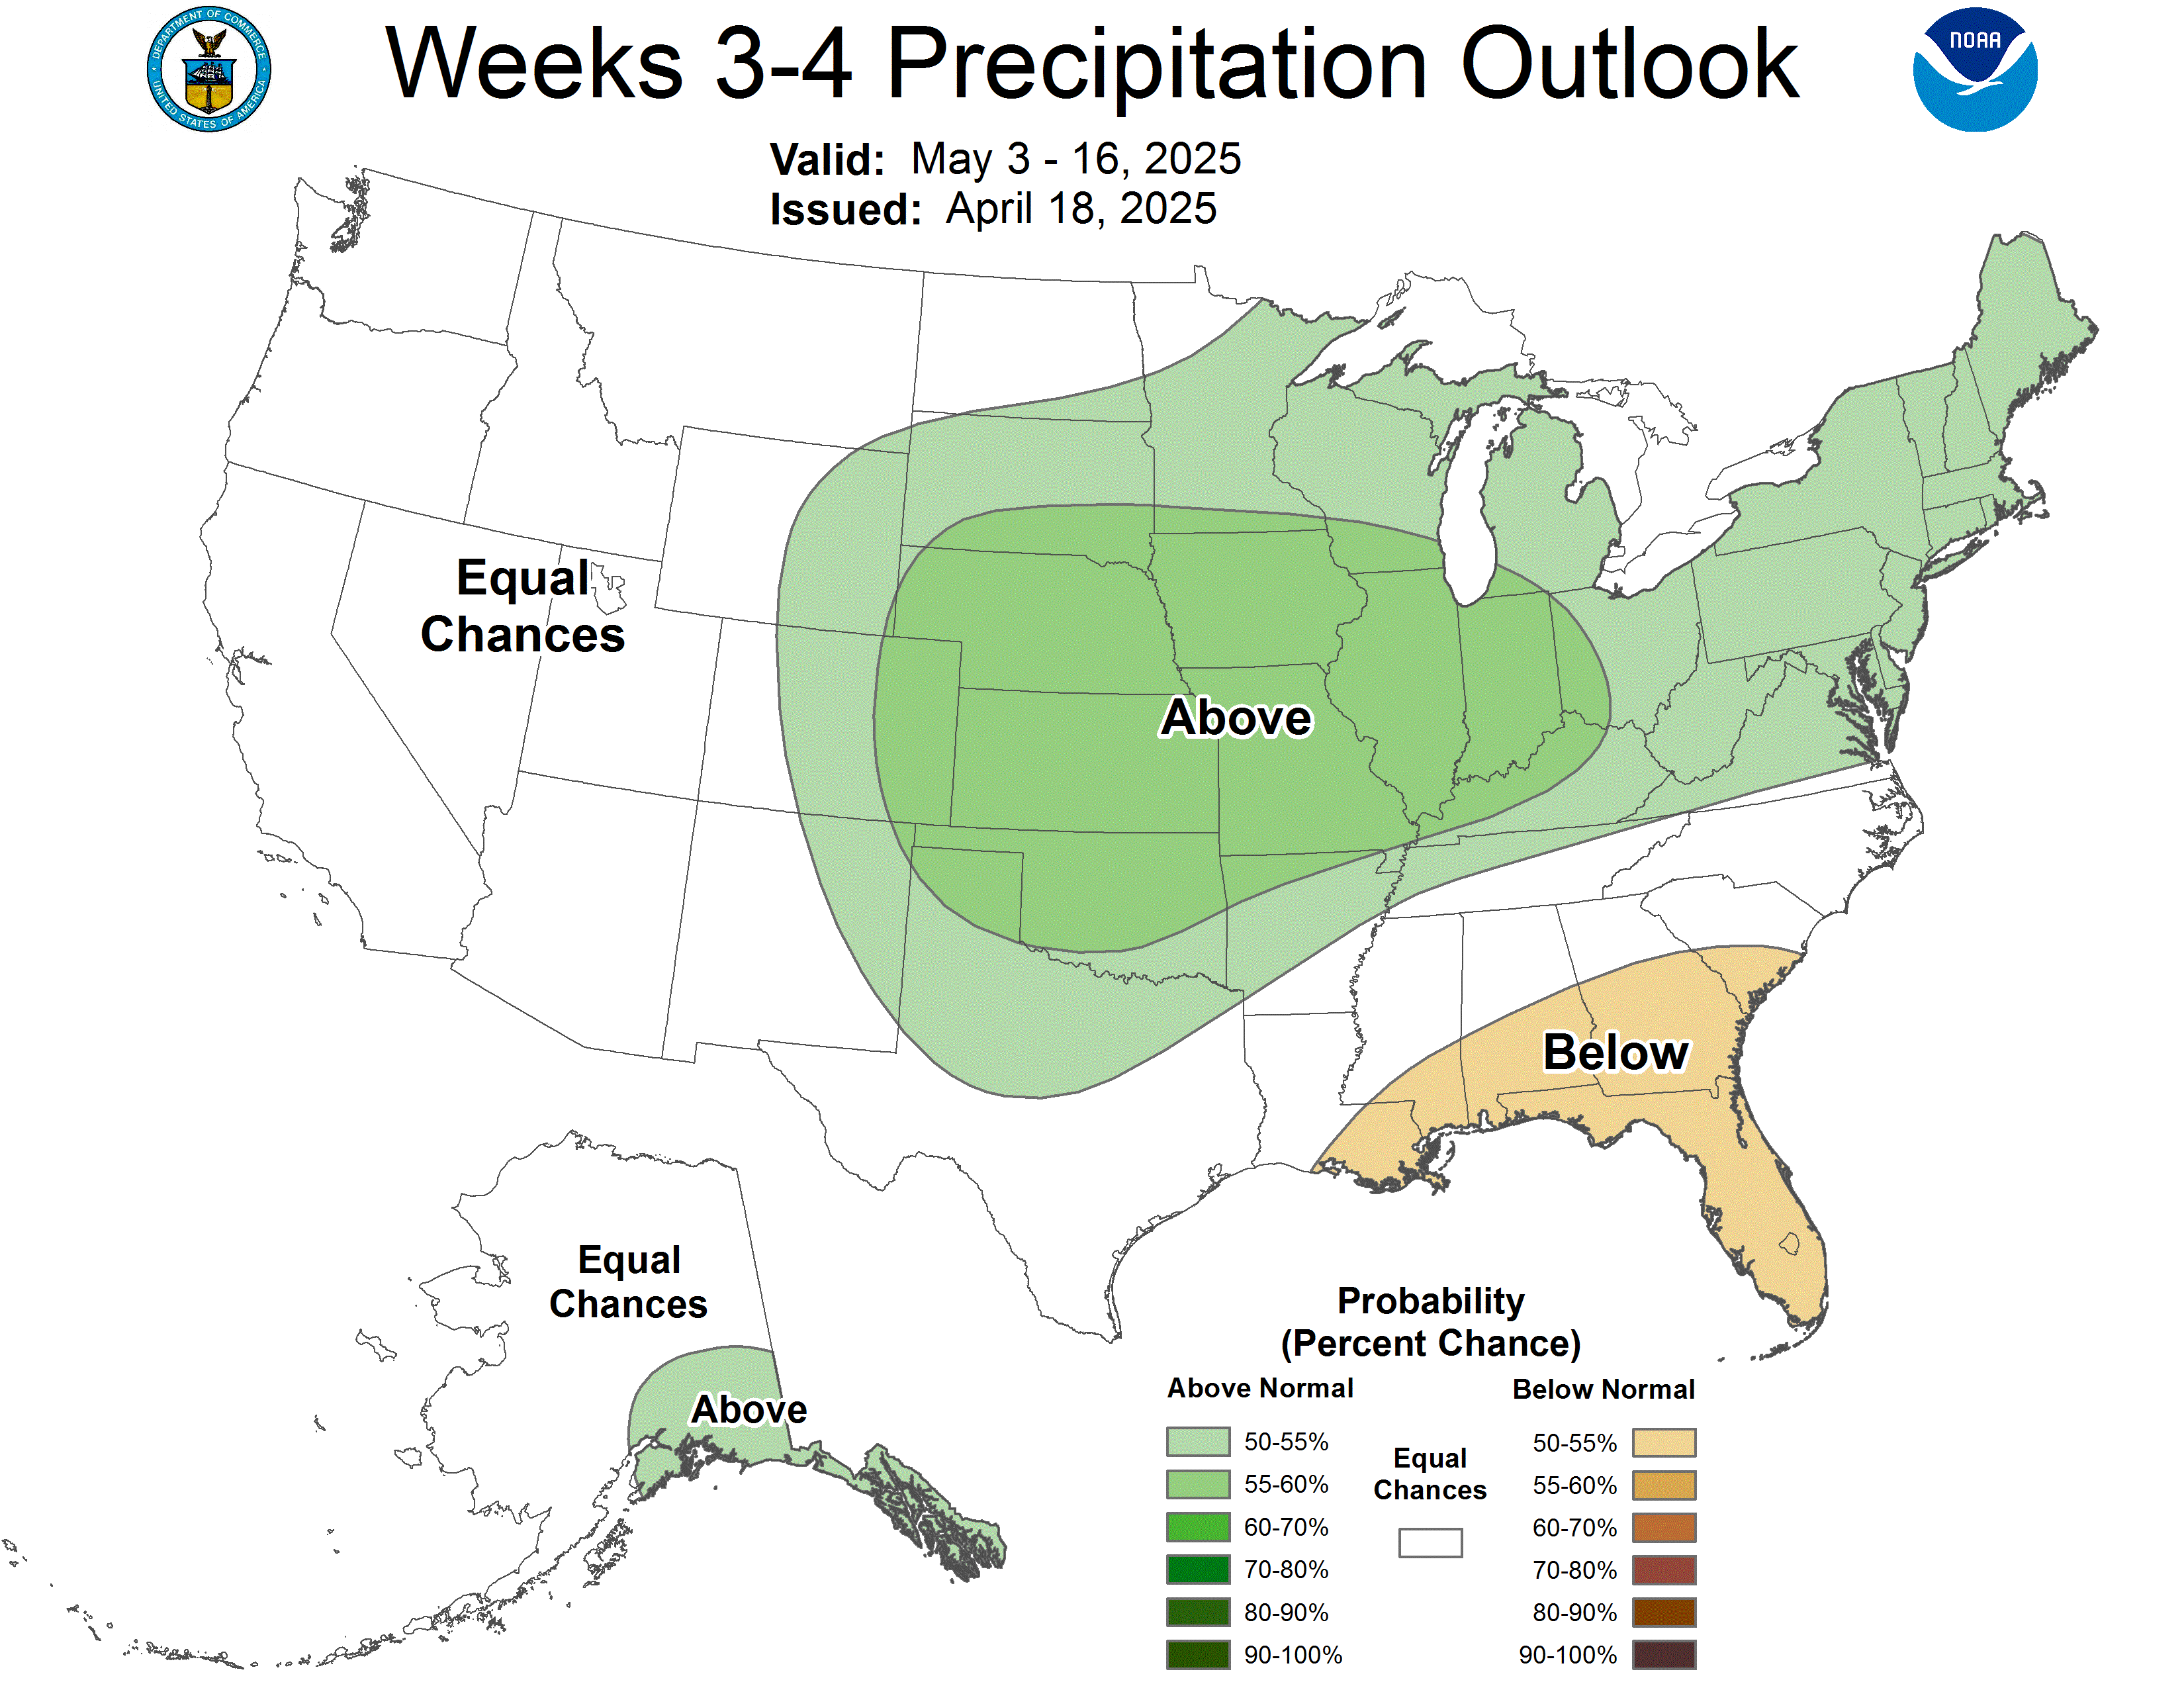
Updated on Fridays. CPC's page and forecaster discussion
Next month
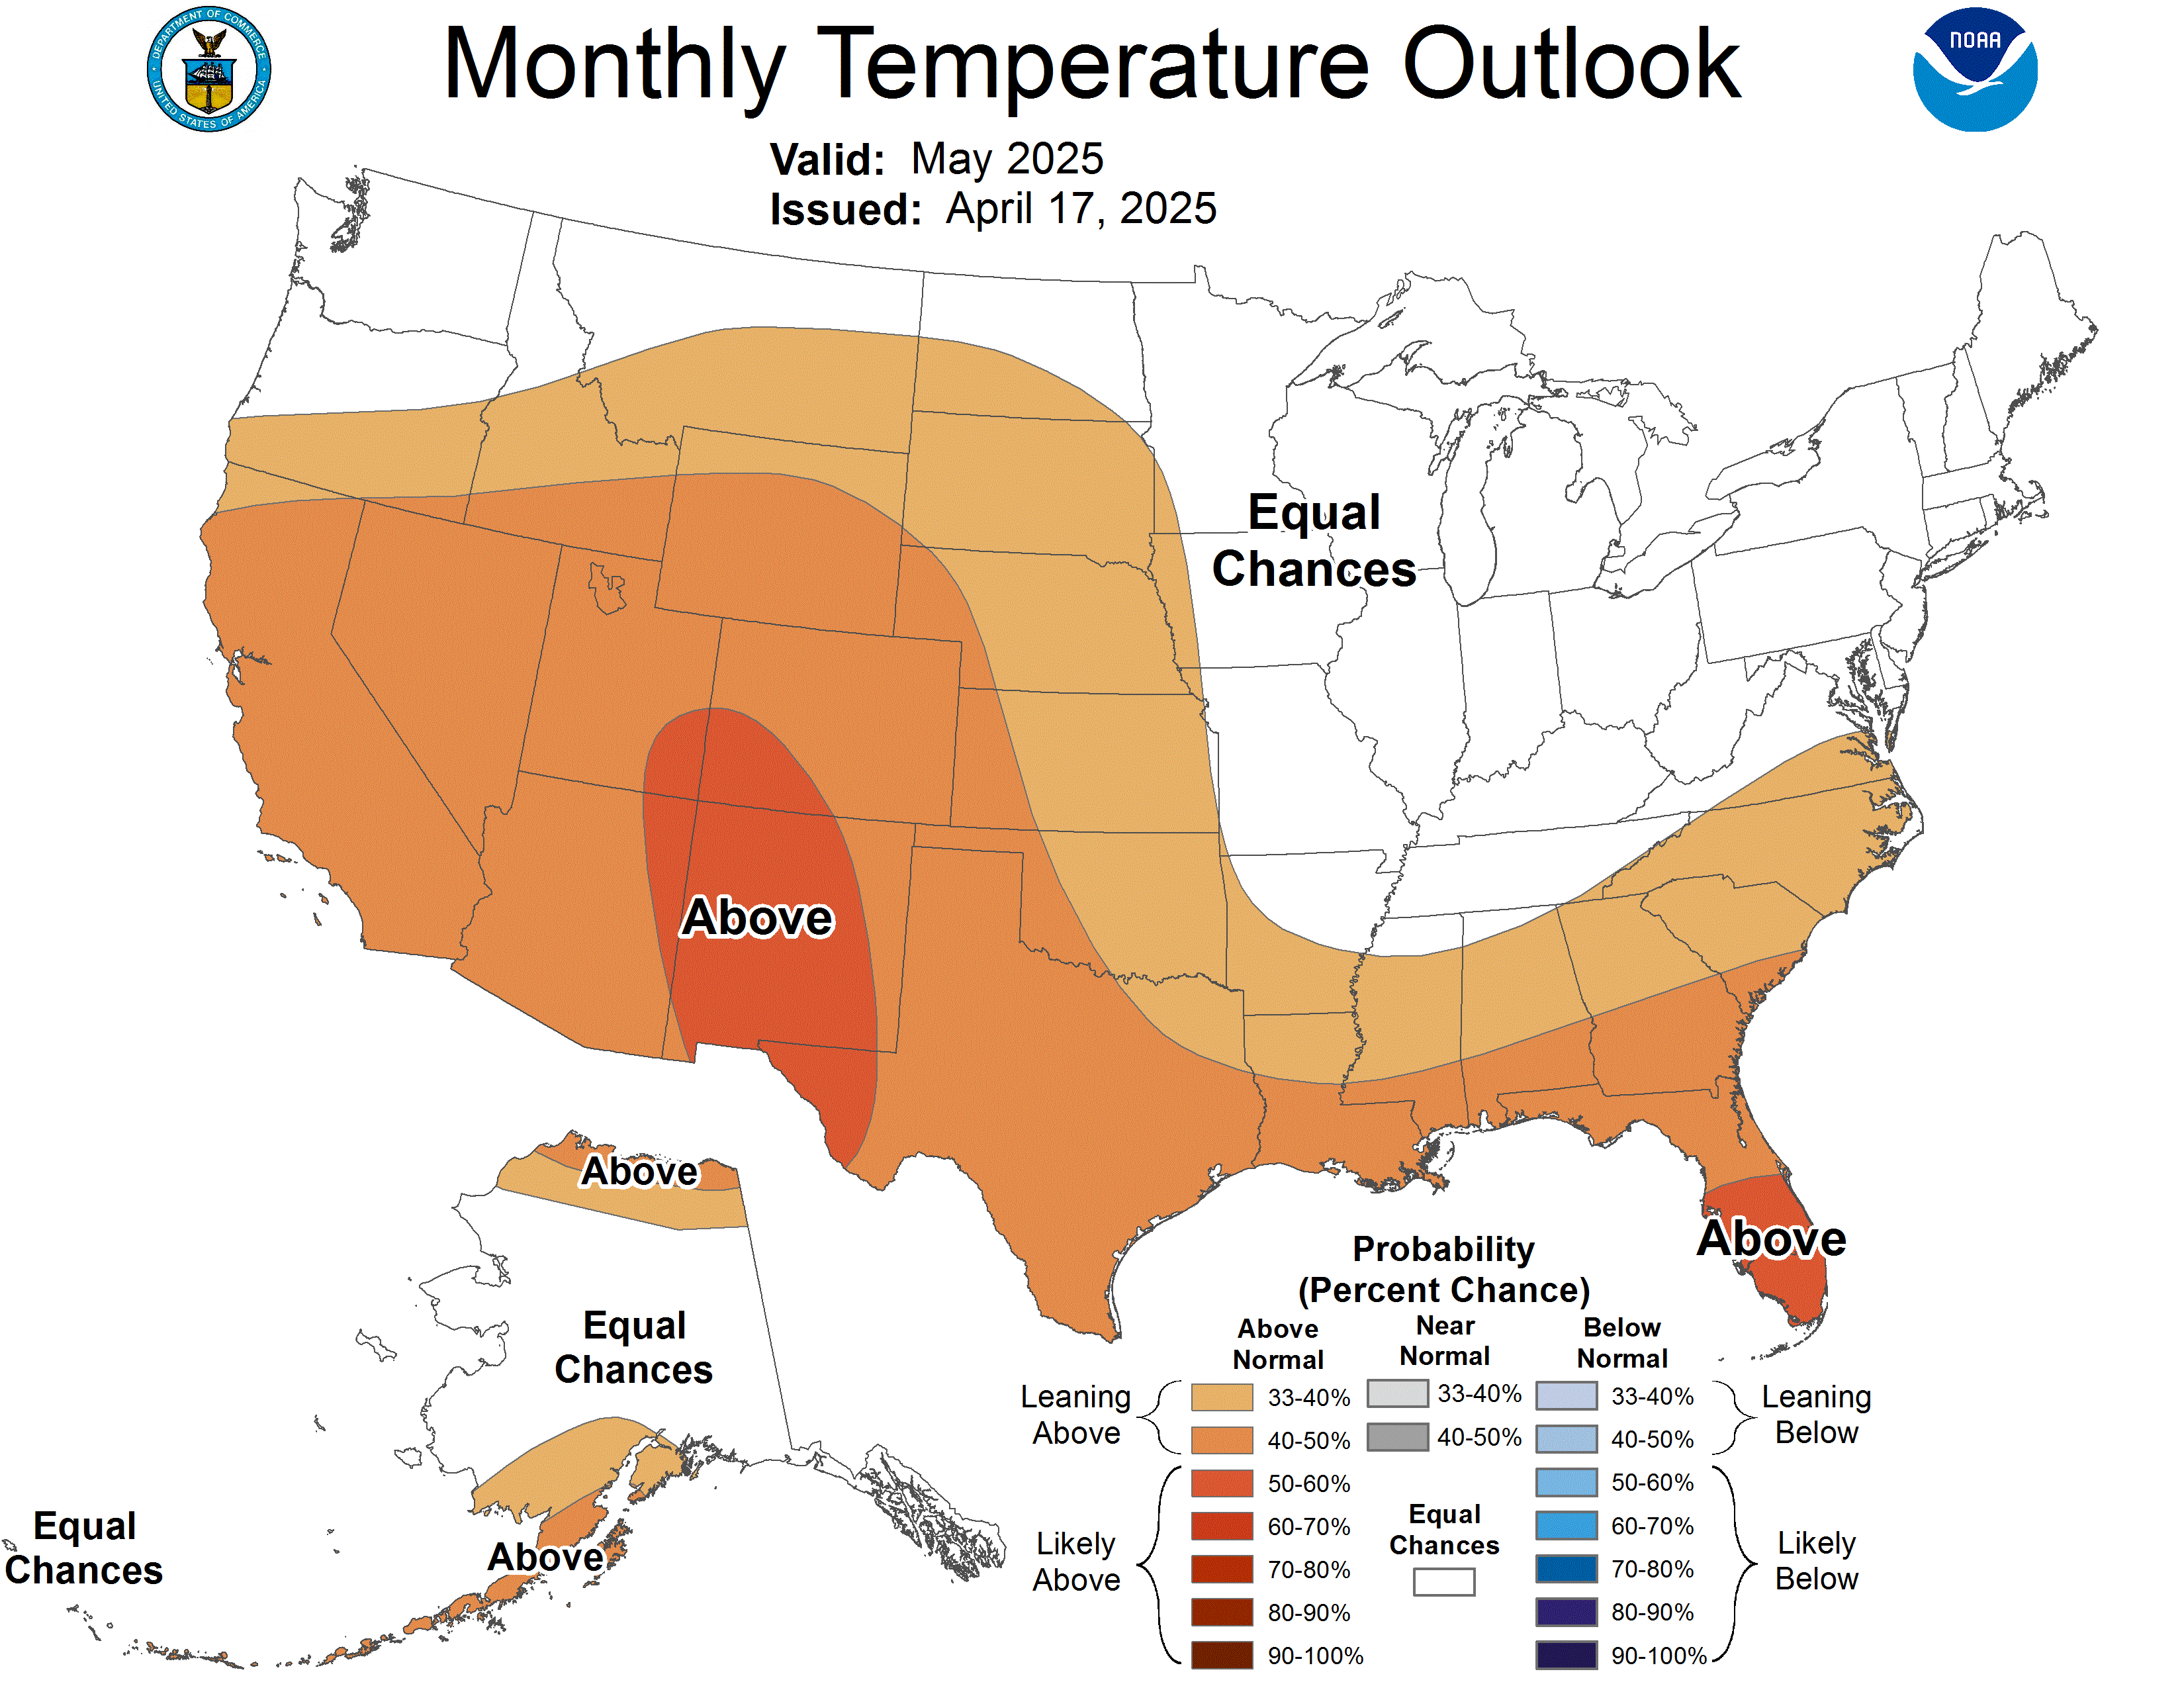
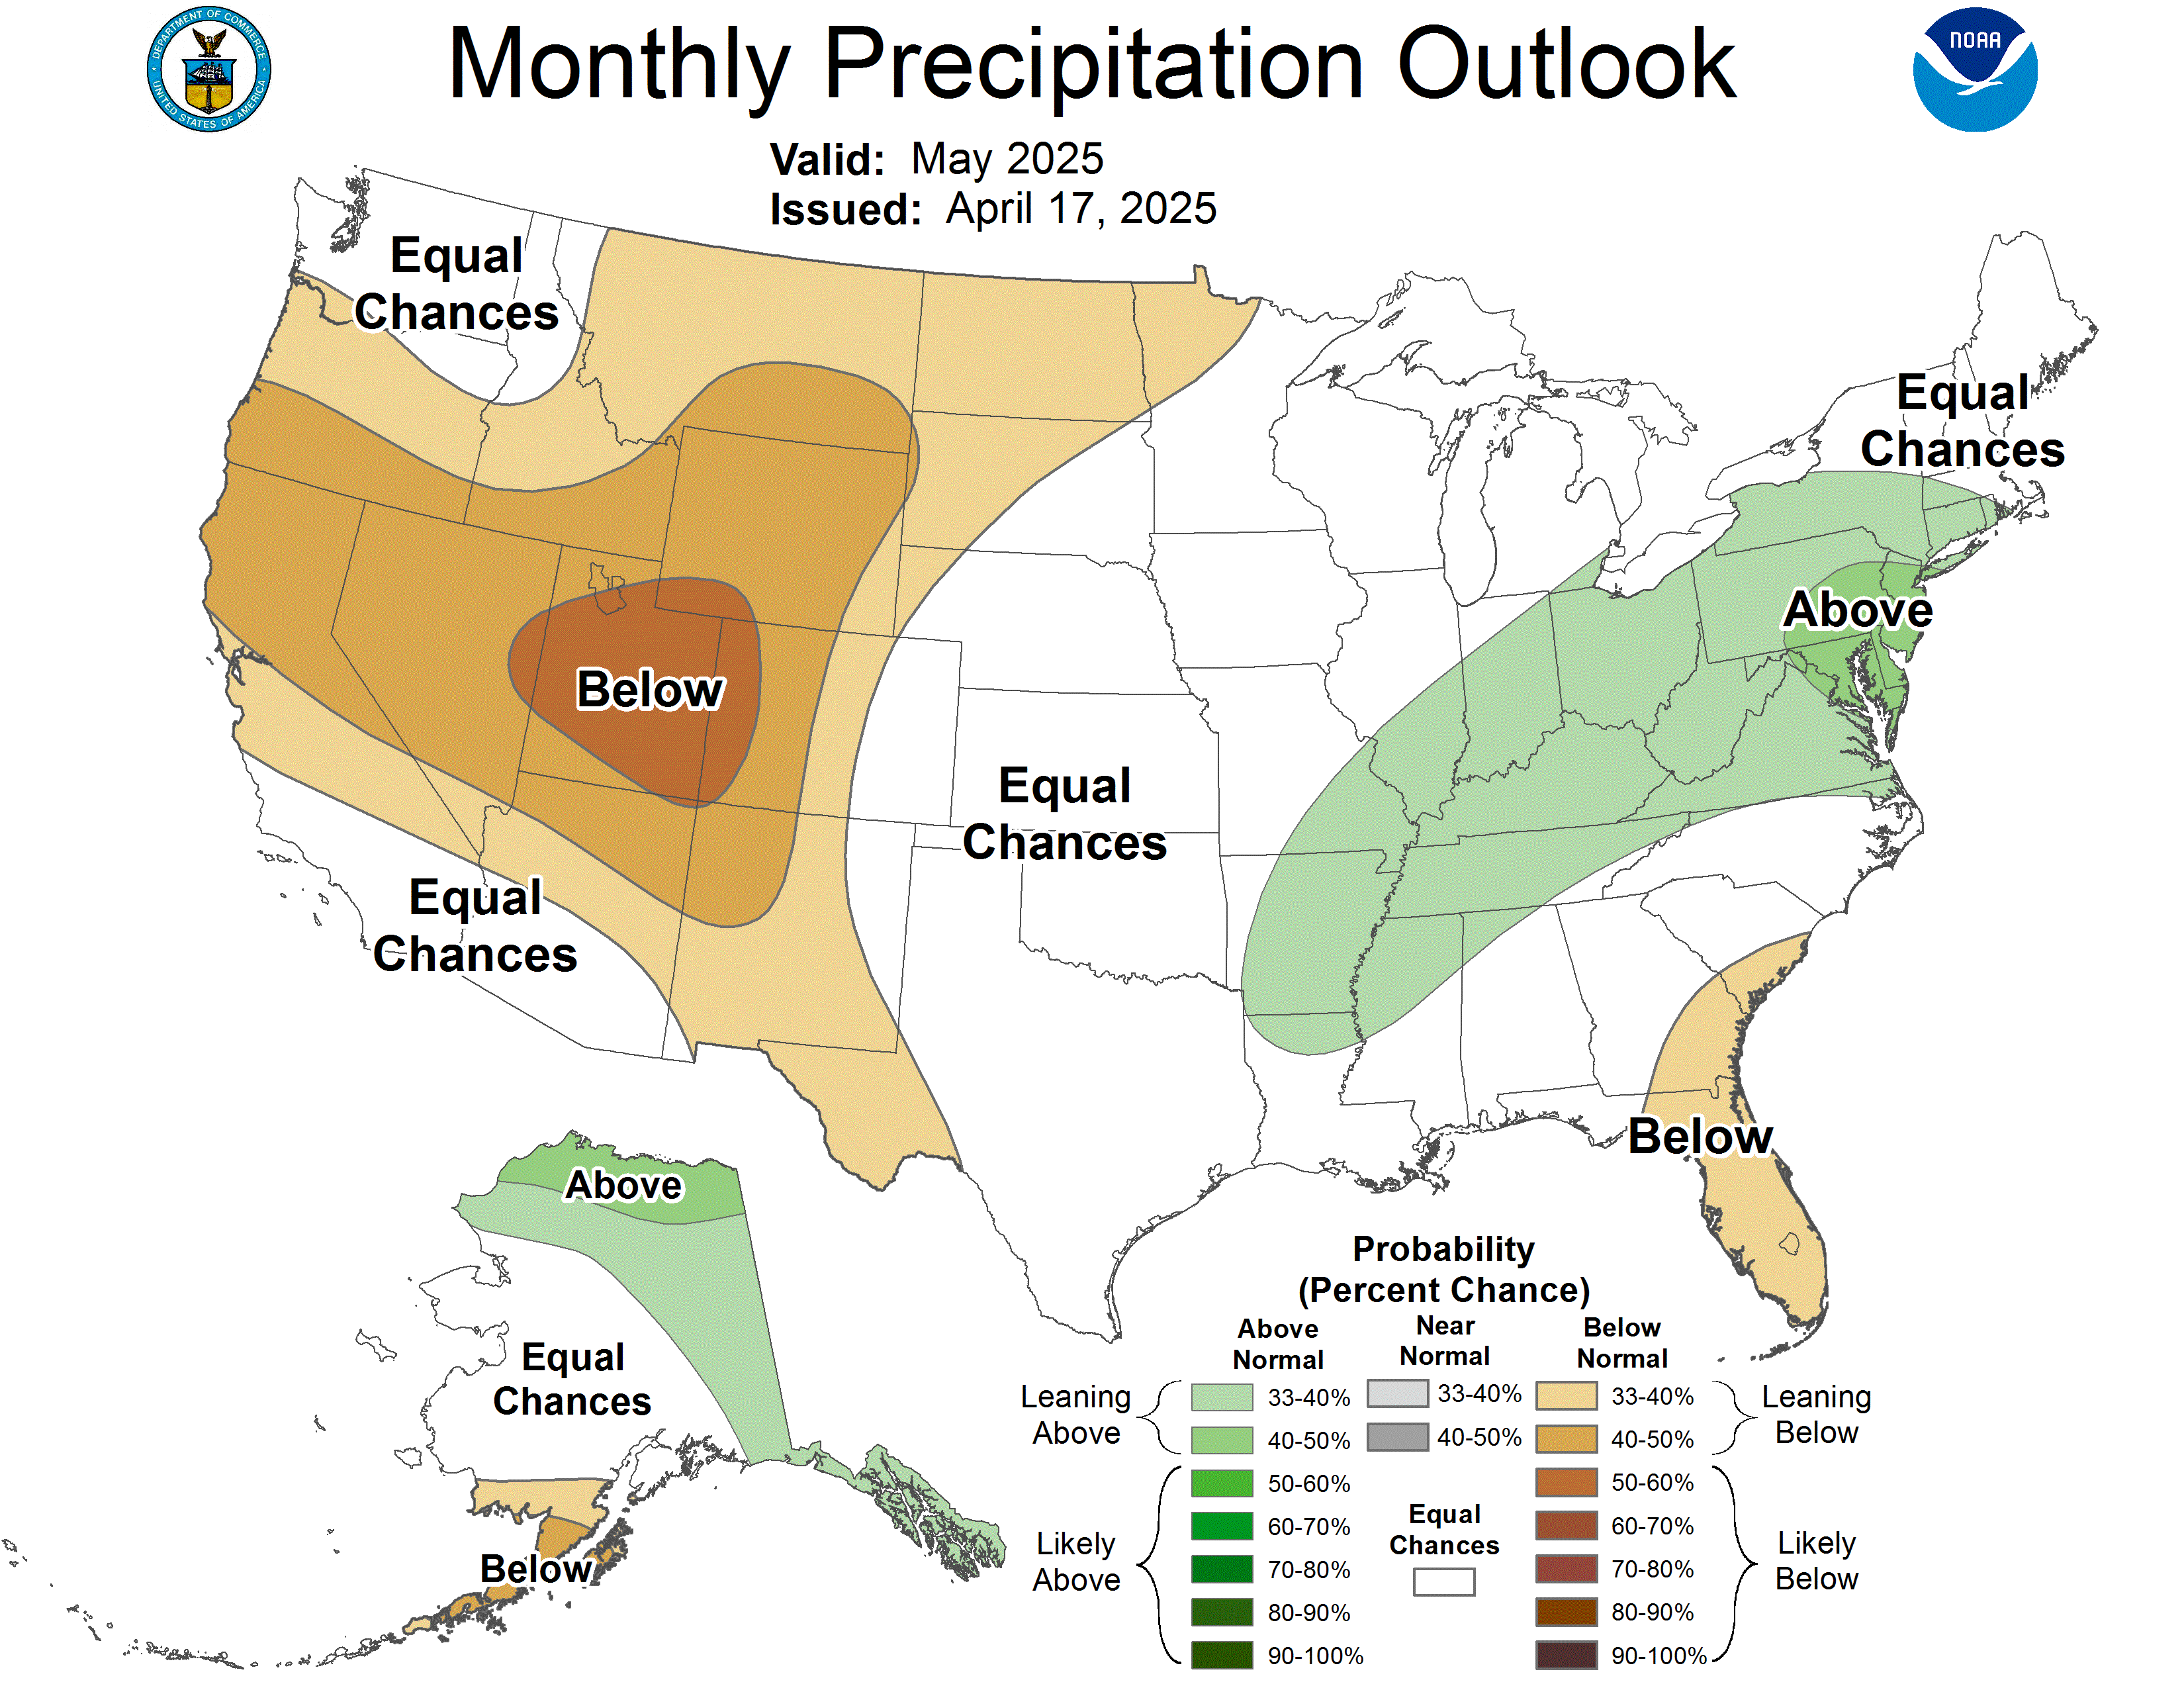
Updated on the third Thursday, with an update on the last day of the month. CPC's page and forecaster discussion
Next 3 months
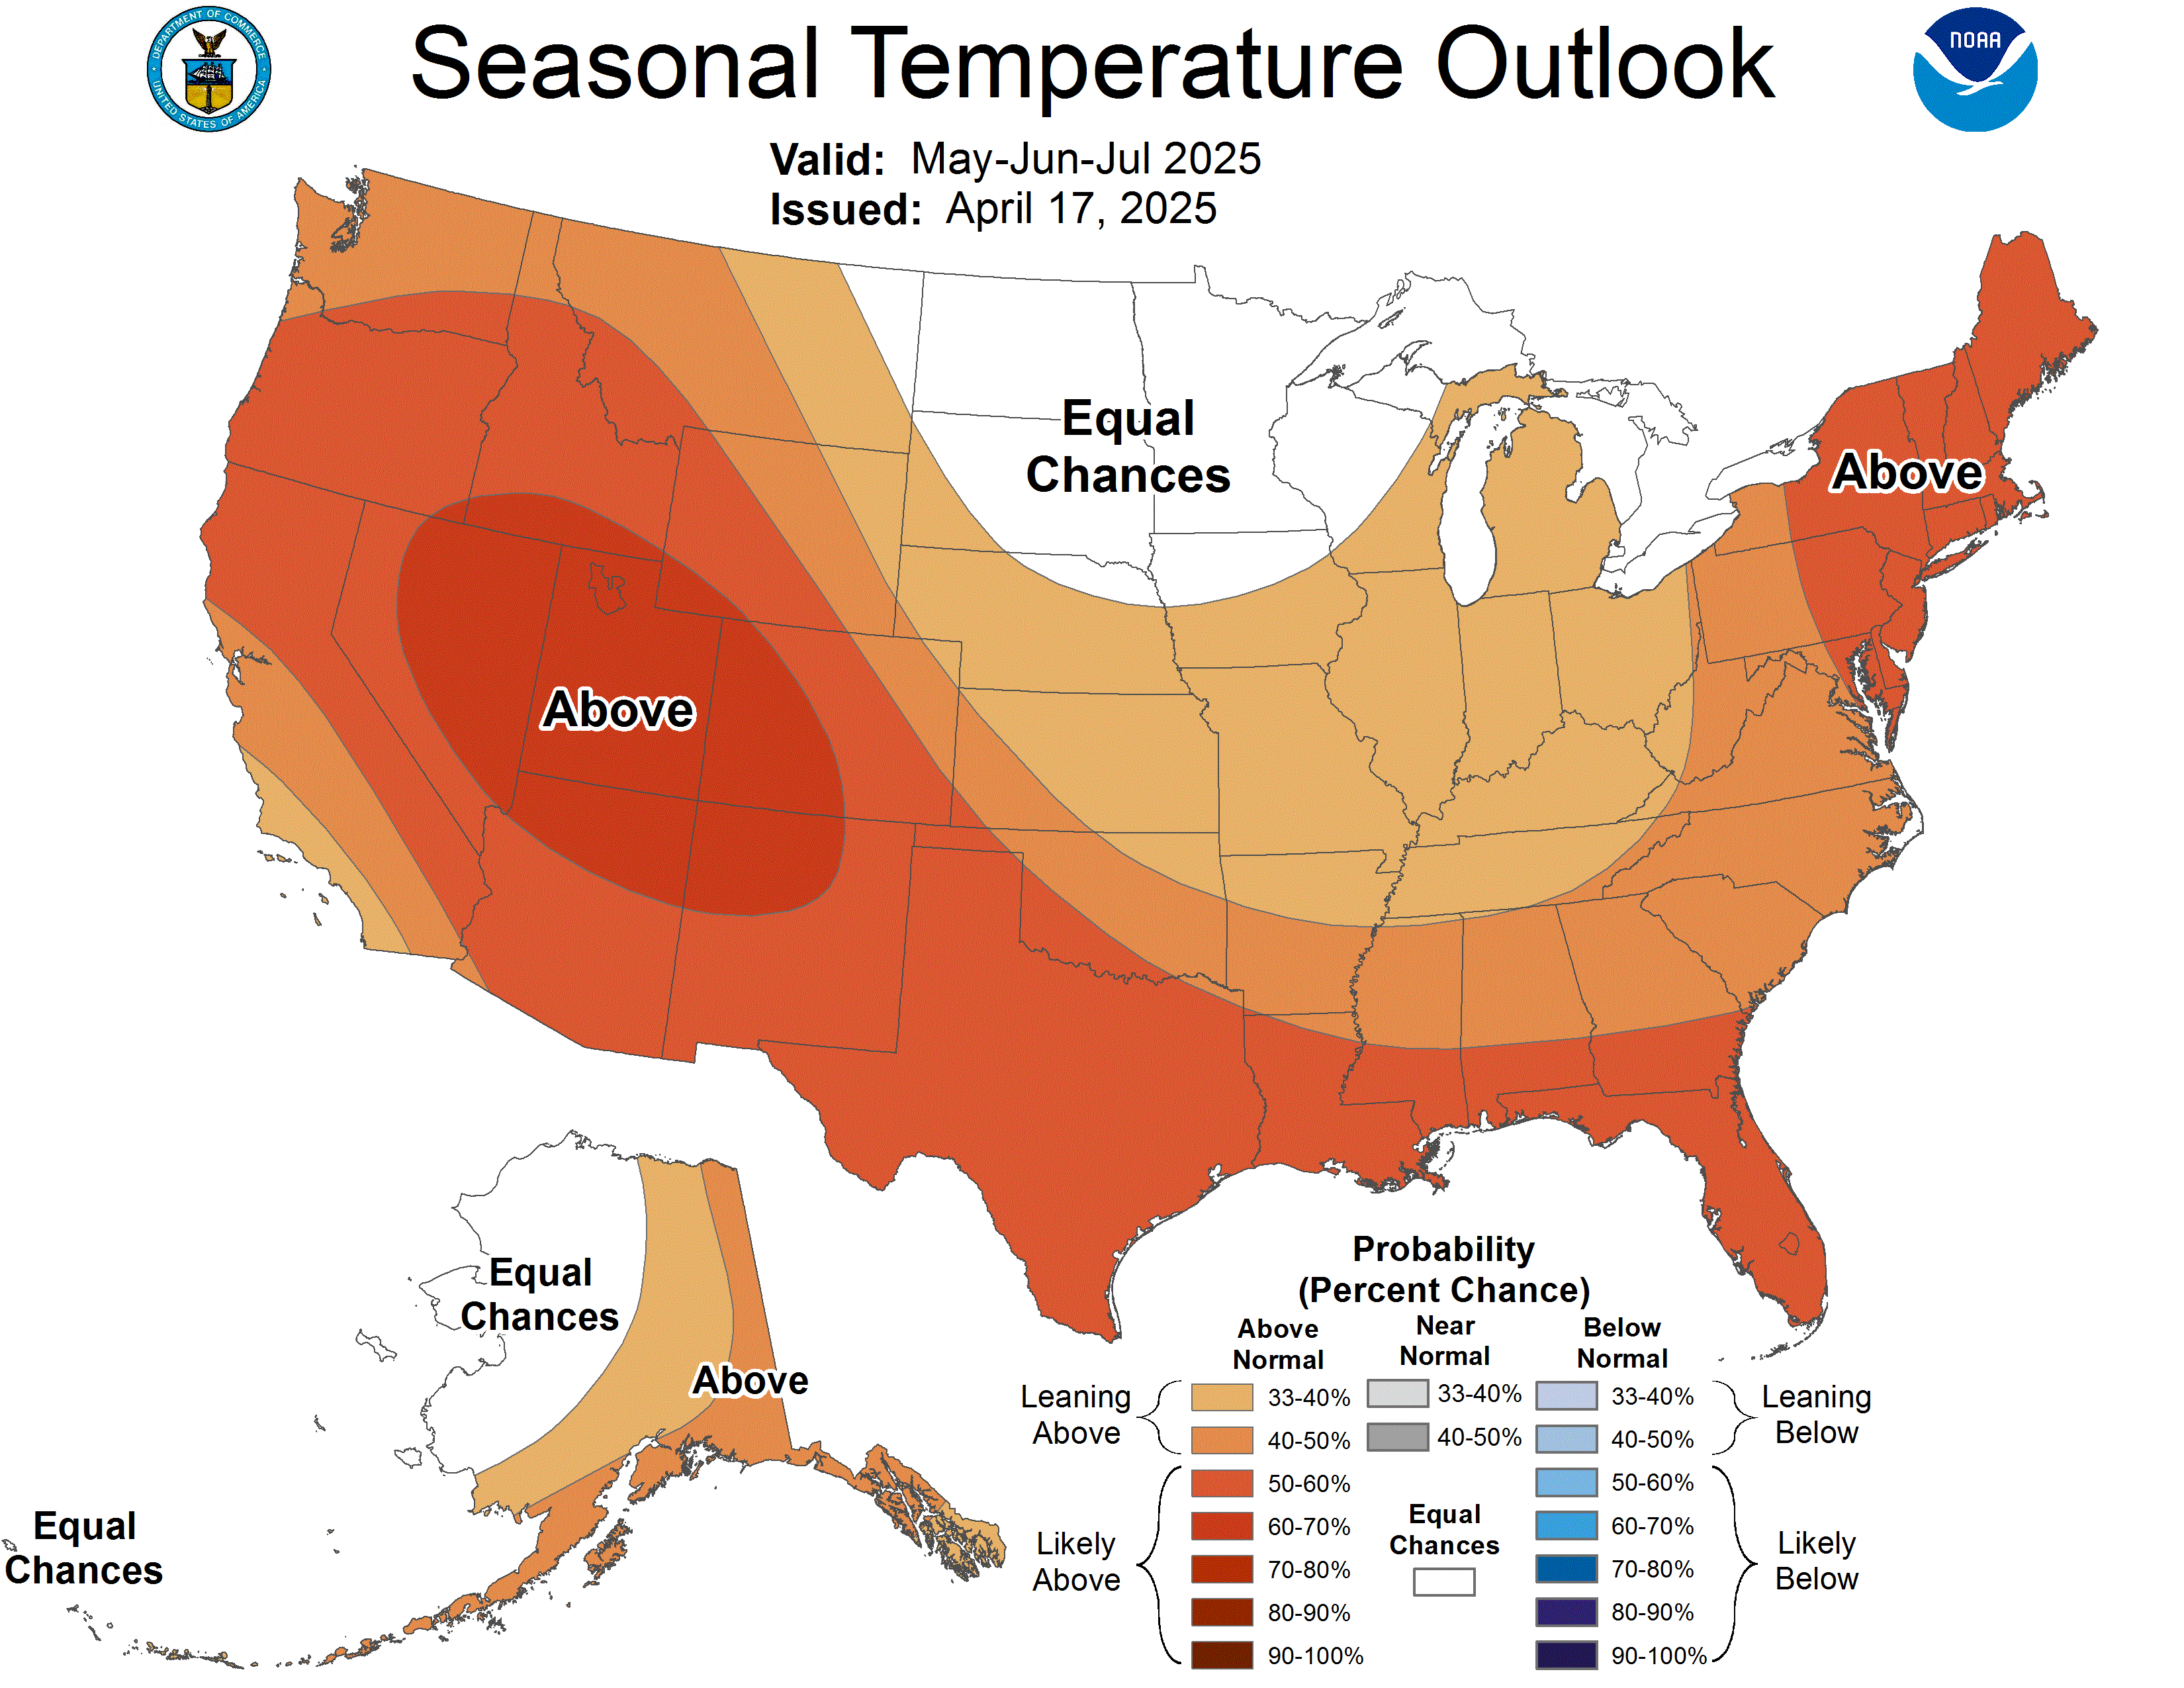
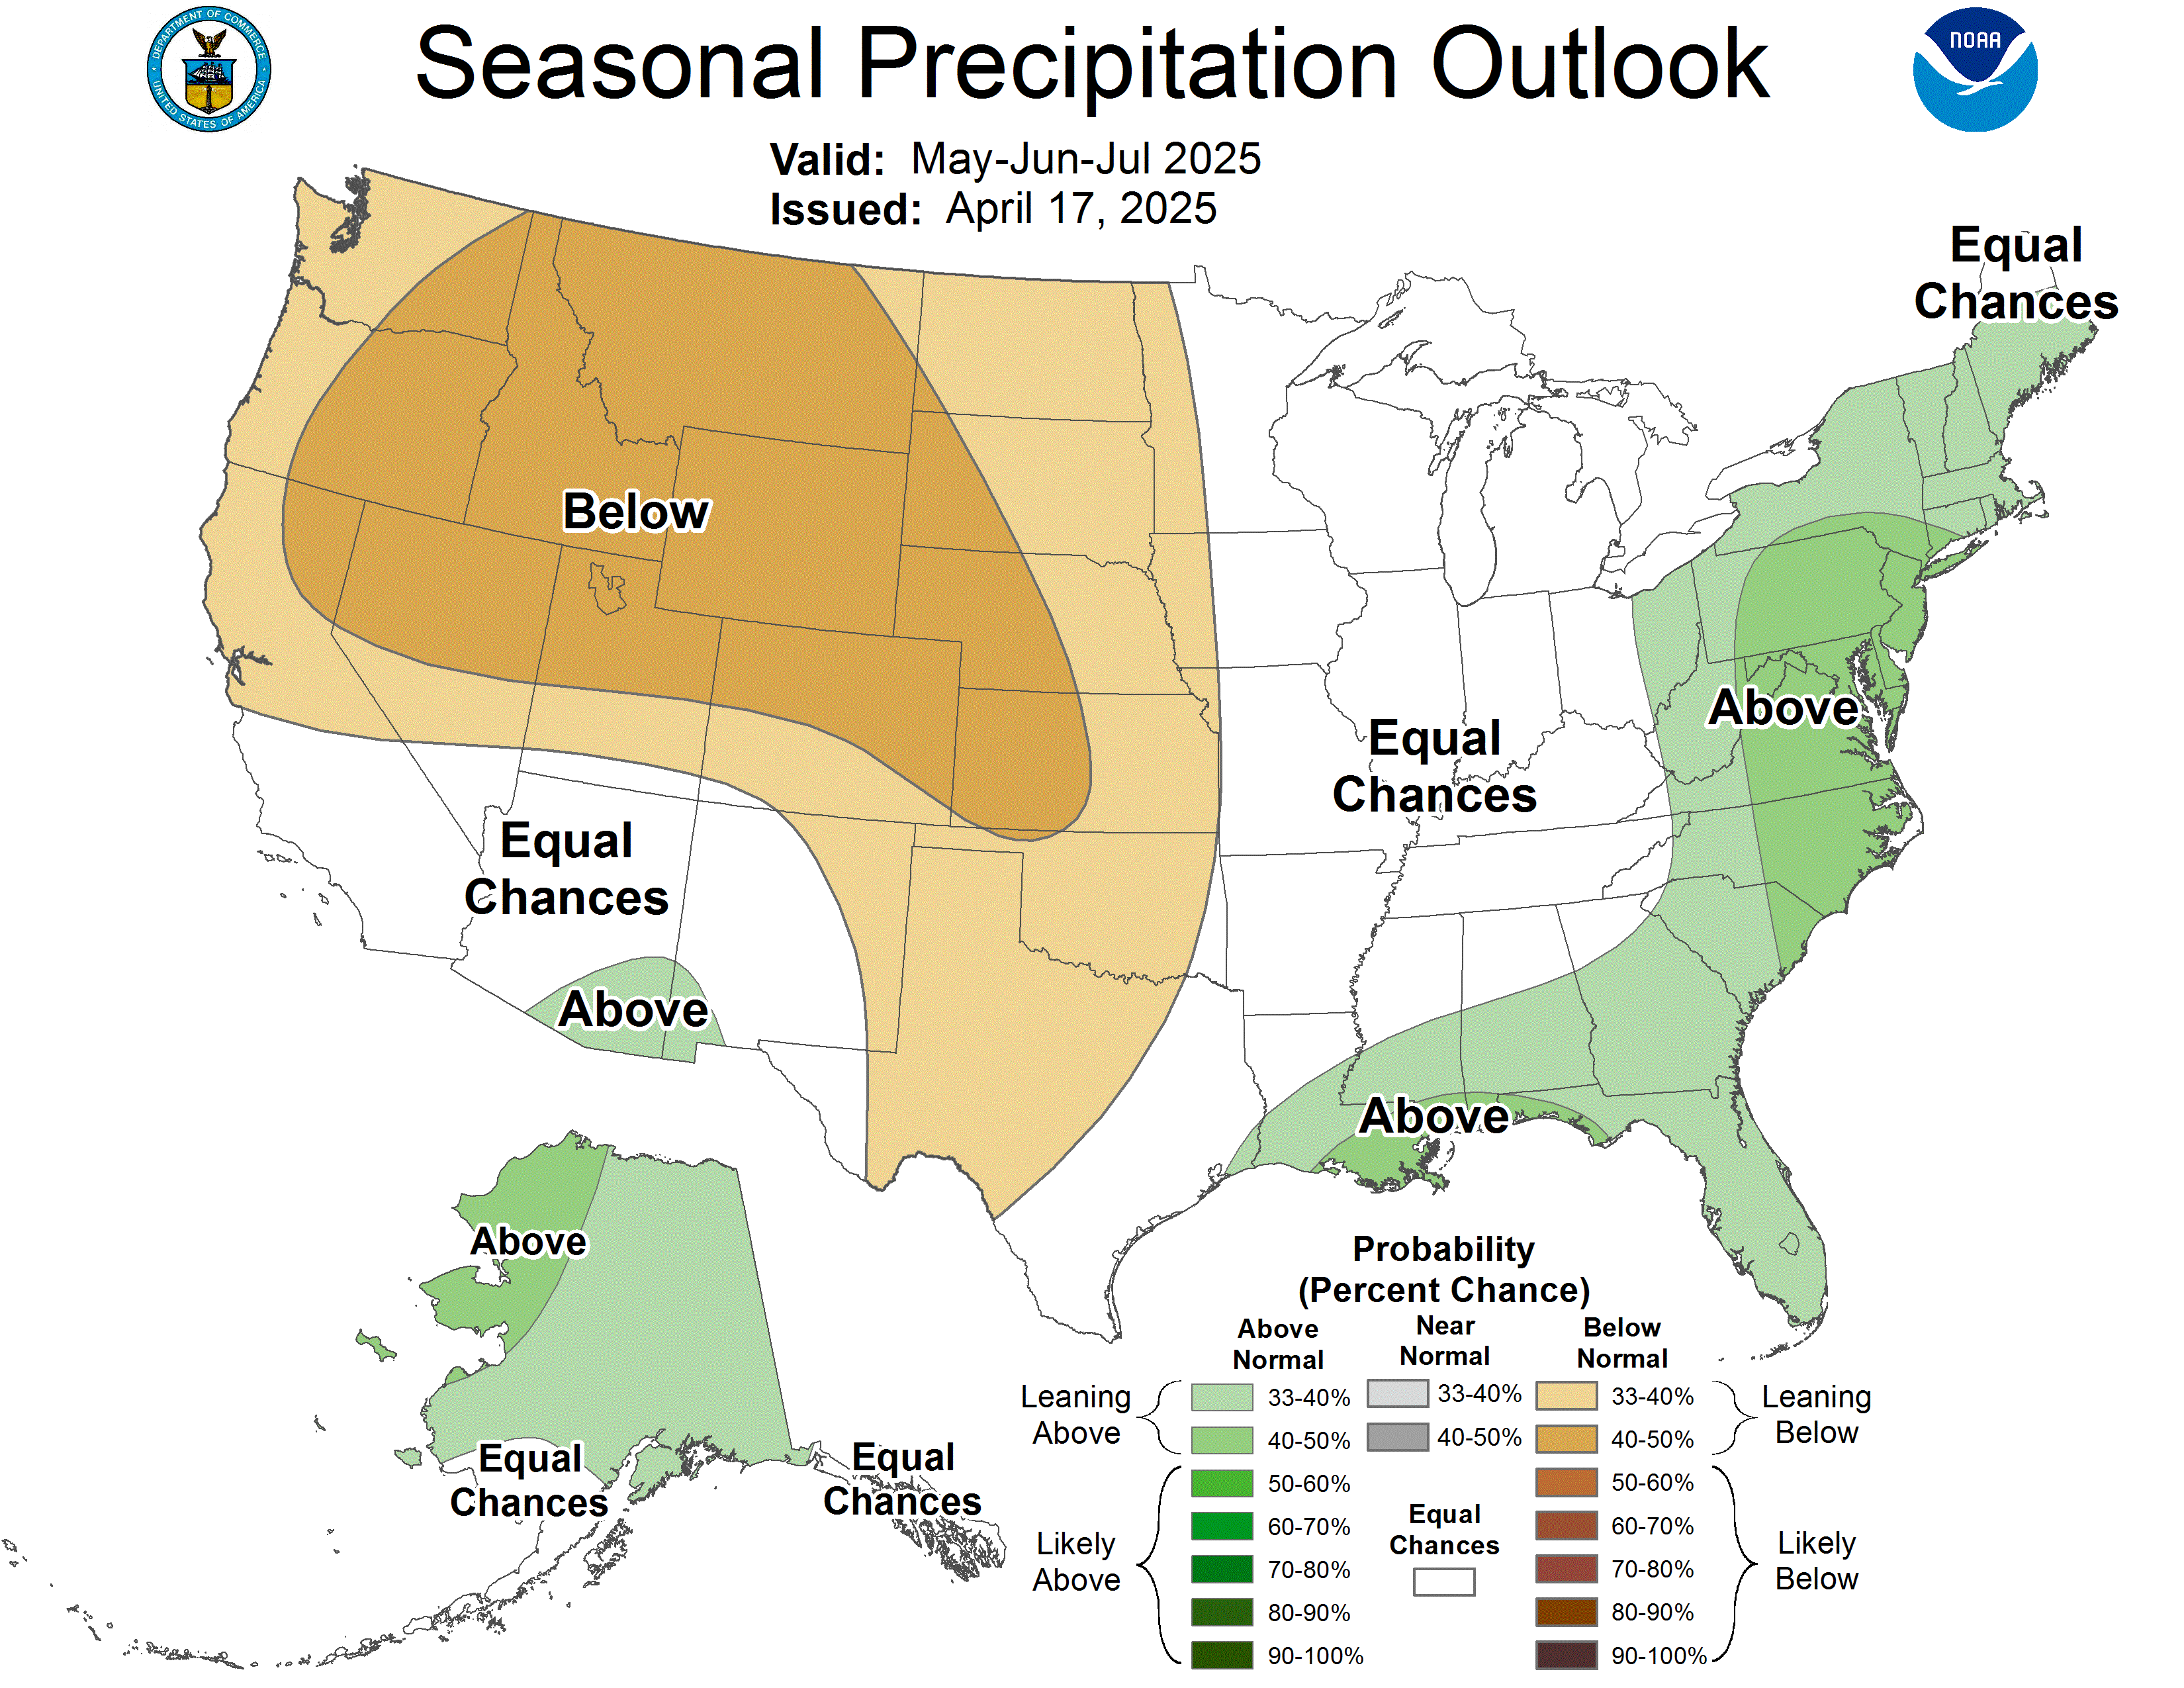
Updated on the third Thursday of each month. CPC's page and forecaster discussion
Reading the outlooks
- Three-way chances. CPC splits the past 30 years into thirds: below, near and above normal. With no lean each has a 33% chance. "Warmer favored, 50%" means 50% warmer, the rest split between near normal and cooler.
- Normal means the 1991-2020 average for that place and time of year, not the weather you'd like.
- They say nothing about single days. A warmer-than-normal week can still have a cold day or a storm. For days 1-7 use the forecast.
- Skill drops with time. 6-10 and 8-14 day outlooks are right more often than weeks 3-4, monthly and seasonal ones.
Outlooks: NOAA Climate Prediction Center (public domain), shown as CPC publishes them. Spot lines read from NOAA's outlook map service. AtmosDays is not affiliated with NOAA.